
CAGR Calculator [Free Tool]
Calculate the Compound Annual Growth Rate (CAGR) of your investments with our easy-to-use CAGR Calculator.
Disclaimer: Please note that the CAGR calculator does not reflect investment risk and all information presented here is for educational purposes only and is not intended to provide financial advice.
What is CAGR?
CAGR, or Compound Annual Growth Rate, is a financial metric used to measure the average annual growth rate of an investment over a specific period. The Compound Annual Growth Rate (CAGR) is a more precise way to measure an investment's performance than just looking at the total return. This is due to the fact that CAGR is a consistent rate of return that considers the reinvestment of an investment's profits year after year. The CAGR calculator is a useful tool for any trader who wants to easily estimate the gains and growth rate of their investments over some time.
How do you calculate CAGR?
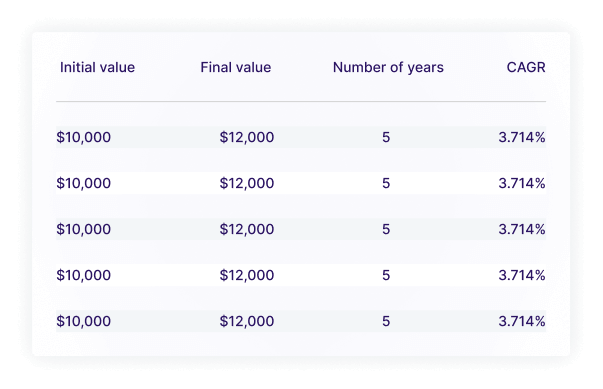
To calculate CAGR, the following variables are required: the beginning value (or present value), the ending value, and the number of years (N). The following CAGR formula is used to calculate the values:
Formula:
CAGR = (Ending Value /Beginning Value)1/N - 1
For example, let's say the initial value of your investment is $10,000, and the ending value is $21,000 in four years (N=4 years). Next up, we will use the mathematical formula to calculate the CAGR.
Formula:
CAGR = ( 21000 / 10000 )1/4 - 1 = 16.93%
Compound growth matters
Now that we have showed you how to calculate the compound annual growth rate, let's explore what happens if there are different financial parameters in play. For the sake of the next example, let's assume you have invested $15,000, five years ago and you want to know what the CAGR (investment performance) was each year.
What are the benefits of using CAGR?
Accuracy
CAGR offers a precise measurement of an investment's performance by considering the compounded annual growth rate. This is in contrast to simpler methods that might only look at the total return, which can be misleading due to volatility and varying time periods. CAGR accounts for the time value of money and provides a more realistic picture of how an investment has grown on an annualized basis.
Consistency
Investment returns can fluctuate significantly from year to year due to market conditions, economic changes, and other factors. CAGR smooths out these variations by providing a consistent, average rate of return over the investment period. This allows for a more stable and reliable assessment of performance, making it easier to compare investments with different return patterns.
Comparability
CAGR allows for straightforward comparison of different investments' performance over the same time period. This is because it standardizes the returns into an annualized growth rate, regardless of the actual investment duration or the timing of cash flows. This makes it easier to evaluate and choose between various investment options, as it provides a common benchmark for comparison.
What are the limitations of CAGR?
Some of the limitations of using a CAGR calculator include:
Volatility
CAGR smooths average growth but ignores price fluctuations during the period. Two investments with the same CAGR could have vastly different risk levels. This matters for risk-averse investors who need to understand the ride, not just the destination.
Past Performance
CAGR relies entirely on historical data. It does not predict future performance, which is influenced by shifting markets, economic changes, or company events. It's a rear-view mirror, not a forecast.
Simplicity
While easy to understand, CAGR doesn't account for taxes, fees, dividends, or inflation. These factors can significantly change your real-world returns and aren't reflected in the raw CAGR number.
External Factors
CAGR doesn't include impacts from geopolitical tensions, interest rate shifts, or recessions. It assumes a controlled world, which is rarely the case for long-term investments.
Distribution Timing
CAGR assumes steady compounding, but real returns may be front- or back-loaded. This skews the perceived growth and doesn't reflect how timing affects final investment value.
Comparison Issues
CAGR helps compare investments but not always fairly. Different asset classes, risk profiles, or strategies can't be fully judged by CAGR alone — it oversimplifies complex performance landscapes.
Frequently Asked Questions
Read our frequently asked questions below. If you still need help, contact us today.
What is CAGR?
How do you calculate CAGR?
What are the limitations of CAGR?
Is the Switch Markets CAGR Calculator free to use?
What is CAGR in trading?
What is a good CAGR percentage?
What is the CAGR day trading strategy?
How does CAGR differ from average annual return?
More Free Tools Brought To You By Switch Markets
It can help you to accurately calculate how your forex trading account equity can be affected after a series of losing trades and eventually even to recoup from previously losing trades.
Forex Profit Calculator
Calculate your profits and losses before or after executing a trade with our free Forex Profit Calculator.
Forex Lot Size Calculator
Use our simple yet powerful Forex Lot Size Calculator to calculate the exact position size for each trade and manage your risk per trade like a pro.
Forex Margin Calculator
Calculate the margin required to open and hold positions with our free Forex Margin Calculator.
Pip Calculator
Calculate the pip value for different currency pairs and position sizes with our Pip Calculator.
Forex Economic Calendar
Access our free economic calendar and explore key global events on the horizon that could subtly shift or substantially shake up the financial markets.
Currency Strength Meter
Compare the performance of major currencies relative to others in real-time with our advanced Currency Strength Meter.
Market Heat Map
Visualize market performance across multiple instruments with our interactive Market Heat Map.
Forex Market Hours & Time Zone Converter
Track global forex market hours and convert between time zones with our comprehensive converter tool.
Forex Swap Calculator
Calculate the swap rate for holding Forex positions overnight before you execute a trade with our free Forex Swap Rate Calculator.
Forex Compound Calculator
Use our Forex compound calculator and simulate the profits you might earn on your Forex trading account.
CAGR Calculator
Calculate the Compound Annual Growth Rate (CAGR) of your trading account or investments.
Forex Drawdown Calculator
Calculate how your forex trading account equity can be affected after a series of losing trades.
Forex Volatility Calculator
Measure and analyze the volatility of currency pairs with our Forex Volatility Calculator.
Fibonacci Trading Calculator
Calculate Fibonacci retracement and extension levels for your trading strategies.
Pivot Point Calculator
Calculate pivot points, support, and resistance levels for your trading analysis.
Stop Loss & Take Profit Calculator
Calculate optimal stop loss and take profit levels for your trades based on your risk management strategy.
Risk to Reward Ratio Calculator
Calculate the risk to reward ratio of your trades to ensure proper risk management.
Win Rate Calculator
Calculate your trading win rate and analyze your trading performance over time.
Risk of Ruin Calculator
Calculate the probability of losing your entire trading account based on your trading strategy.
Forex Forward Rates Calculator
Calculate forward exchange rates for currency pairs based on interest rate differentials.
Trade Return Calculator
Calculate the return on investment for your individual trades and overall trading performance.
Value at Risk Calculator
Calculate the Value at Risk (VaR) for your trading portfolio to assess potential losses.
VWAP Calculator
Calculate the Volume Weighted Average Price (VWAP) to identify optimal entry and exit points.
Monte Carlo Simulation
Project your future trading returns by running randomised scenarios based on your strategy variables.
Not Ready to Trade Live? Trade confidently with a demo account in a live-like setting. Try Demo Trading