What Are the Best Indicators for Day Trading?
If you’re day trading without indicators, you’re basically flying blind.
The market moves fast, and gut feelings just don’t cut it in today’s algorithm-driven trading world. You need tools that can help you spot trends, time entries, and avoid getting whipsawed by noise. That’s where technical indicators come in. They are obviously not magic wands, but they act as decision aids that cut through the chaos.
In this guide, we’ll show you how pro traders use a blend of indicators to stay sharp with their day trading decisions. After reading, you’ll have all the tools you need to scalp price trends or catch reversals in the financial markets. These are the tools that can give you the edge.
Let’s break them down.
What Are Technical Indicators?
Technical indicators are mathematical calculations based on a security’s historical price and volume data. They can be plotted over price charts (called overlays) or below them (called oscillators) to highlight different market aspects.
For example, moving averages are overlays that smooth out prices to reveal trends, while RSI or MACD are oscillators that flag momentum and overbought/oversold conditions. Technical analysis is especially common in day trading, where traders focus on short-term price movements.
In general, indicators fall into two types: leading indicators (which attempt to forecast future moves) and lagging indicators (which confirm trends after they begin). Together with price patterns and other advanced trading tools, they help traders judge when to buy or sell.
What Are the Best Technical Indicators for Day Trading?
Surely, there is no one “magic” indicator for day trading. Different traders find success with different indicators. As such, as a beginner, the best approach is to use a handful of tools that complement each other until you find your own set of indicators that works best for your needs. A good day-trading indicator should give timely signals in fast markets and align with your trading style and timeframe.
Here's our list of the top day trading indicators:
Effective traders often combine a trend-following tool with a momentum oscillator and a volume-based indicator. For example, one might use a moving average to identify the trend, an oscillator like RSI or MACD for momentum, and a volume indicator like OBV for confirmation. The key is to understand each indicator’s strengths and limitations and use them to confirm what the price action is suggesting. Below, we explain how each of the best day trading indicators works and how to properly use them in day trading. Take note that all of the indicators below are available on our MT4/5 trading platforms.
RSI (Relative Strength Index)
The Relative Strength Index (RSI) is a popular momentum oscillator that measures recent price gains against losses on a 0 - 100 scale.
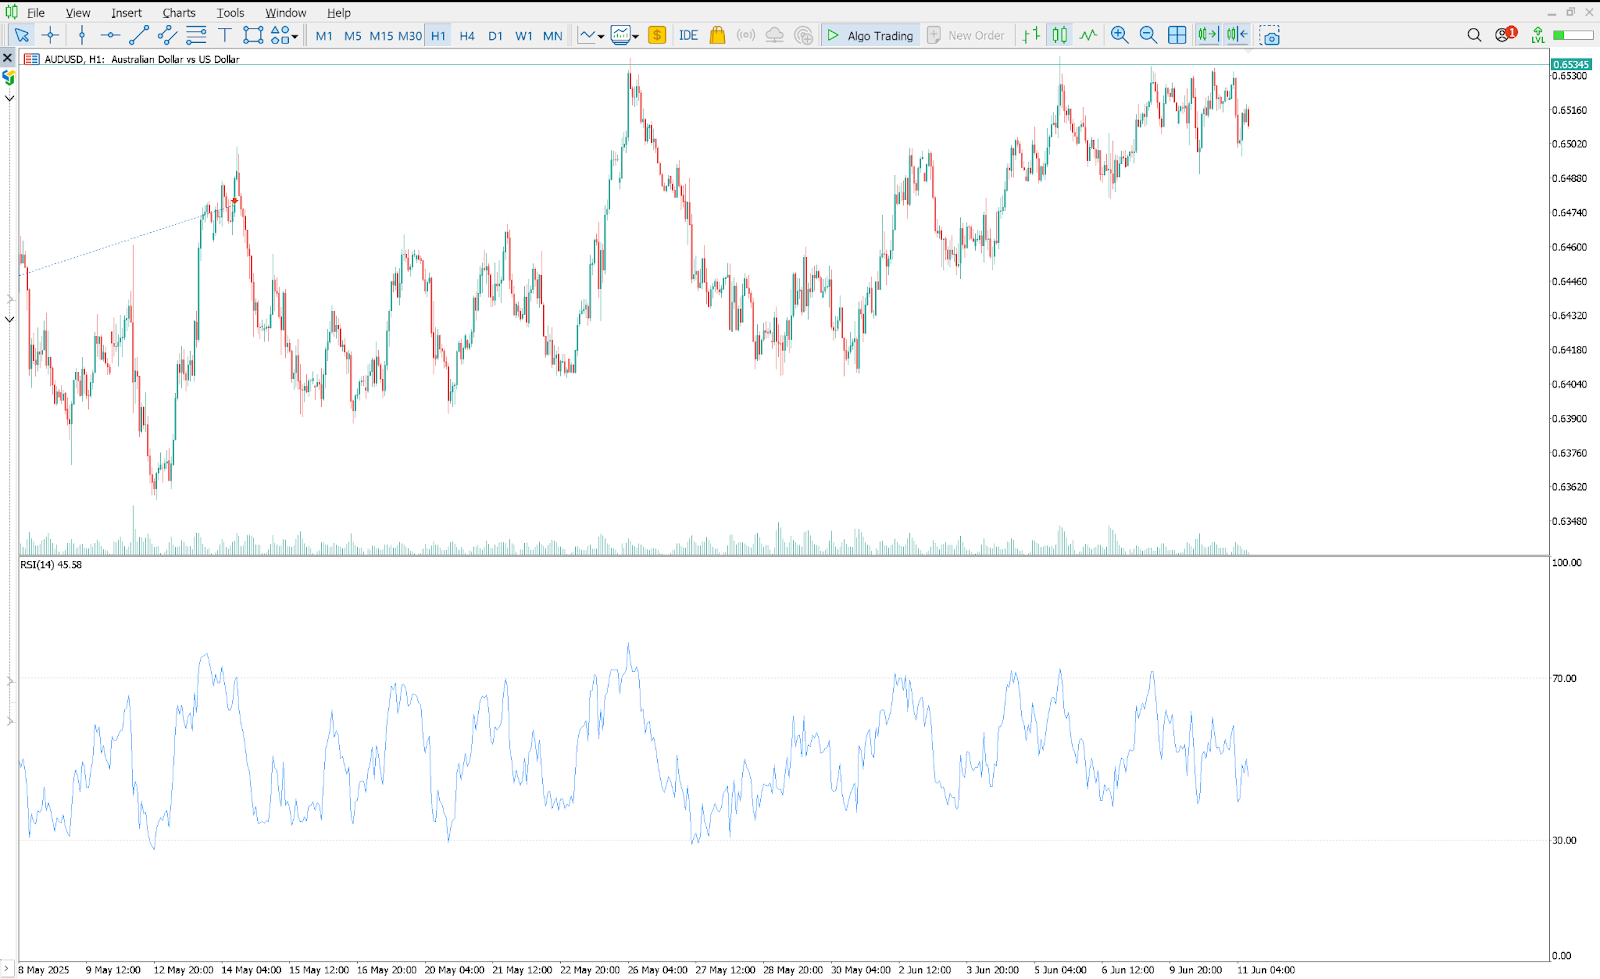
On the chart, it appears as a single line below the price, often with horizontal markers at 70 and 30. An RSI above 70 is traditionally seen as overbought (the price may be high and due for a pullback), while an RSI below 30 is oversold (the price may be low and poised to rise). However, you should note that in some cases, a reading above 70 or below 30 actually indicates a strong trend, and as such, some traders prefer to use the 80 and 20 levels as more accurate signals.
How to Use the RSI for Day Trading
Day traders often watch the RSI for quick reversals around the overbought or oversold levels: for example, if RSI crosses back down below 70 after being above, it can signal a sell; if it crosses up above 30 from below, it can signal a buy. However, quite often, traders also might use the 70 and 30 levels as an indicator to join the trend. This typically depends on the context and the market conditions. Traders also often use the 50 level as a signal to enter and exit trades.
Lastly, divergences between RSI and price also offer clues: if price makes a new high but RSI fails to follow, the uptrend may be weakening.
In practice, RSI is best used as a range tool rather than in a strong trending market. In a strong trend, RSI can remain overbought or oversold for a long time, producing false signals. For day trading, use RSI to highlight potential turnpoints in relatively choppy markets, but wait for confirmation before acting.
What to remember: When using the RSI (Relative Strength Index), don’t rely solely on the standard overbought (70) and oversold (30) levels — in strong trending markets, RSI can stay overbought or oversold for extended periods. Instead, watch for divergences between RSI and price action — they often provide more reliable signals for potential reversals or trend exhaustion.Moving Averages (EMA and SMA)
Moving averages smooth price data to reveal the market’s trend direction. A Simple Moving Average (SMA) gives equal weight to all points over a chosen period, while an Exponential Moving Average (EMA) weights recent prices more heavily.
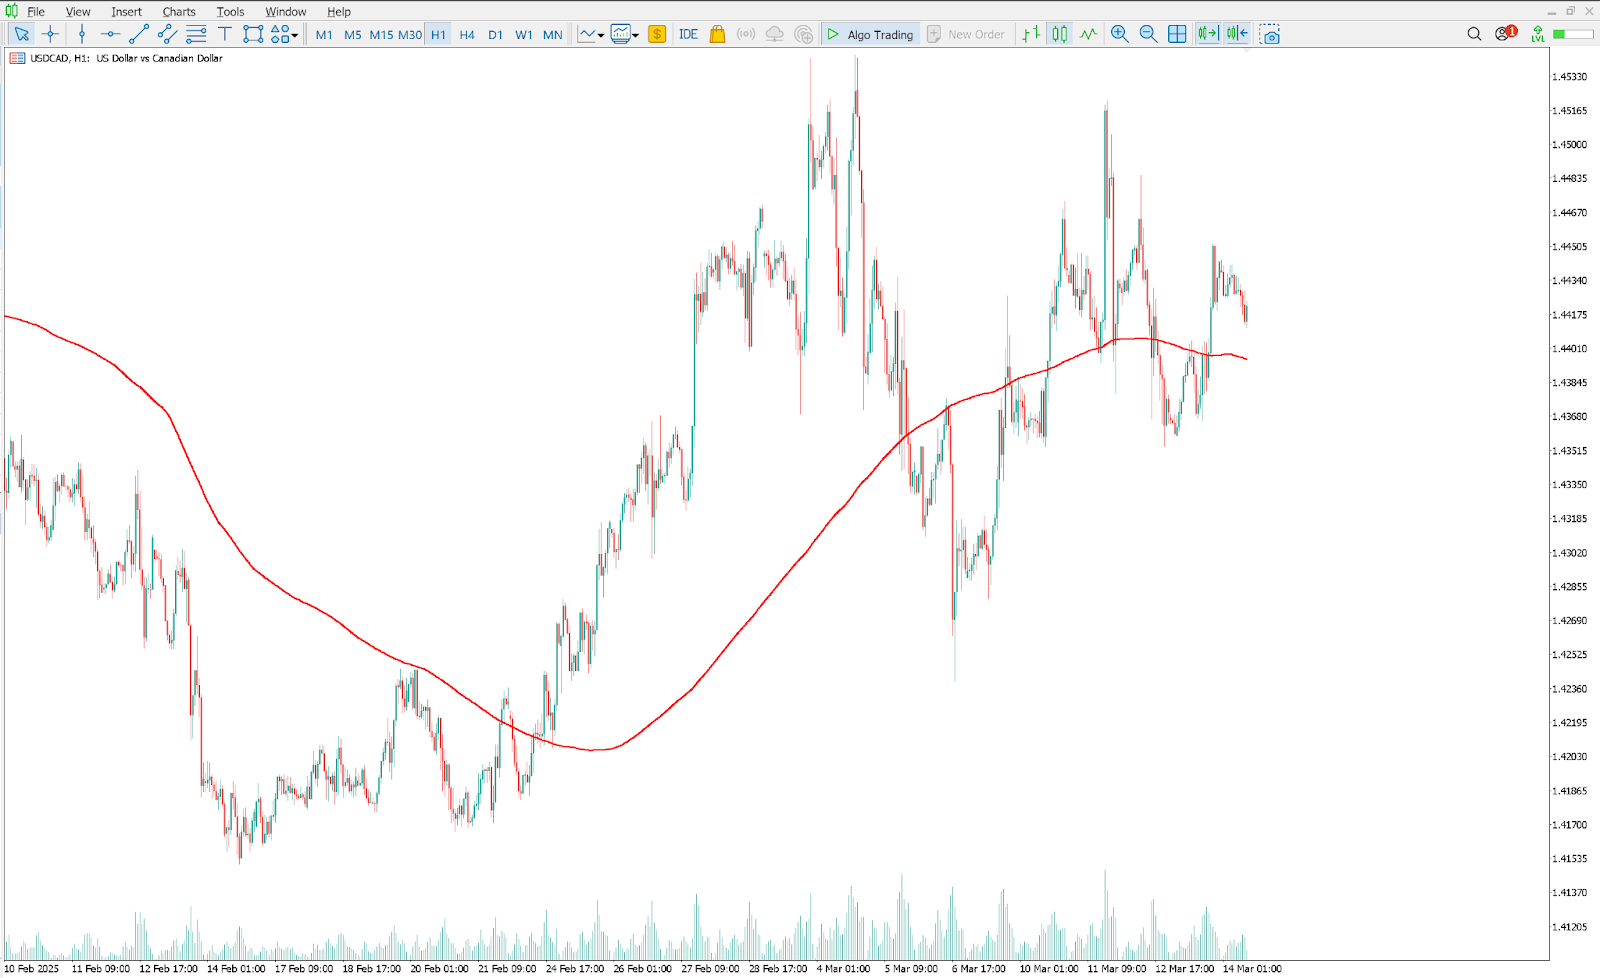
Moving averages are drawn as lines overlaid on the price. When the price stays above a moving average, it suggests an uptrend (acting as dynamic support); below it suggests a downtrend (acting as resistance).
How to Use Moving Averages for Day Trading
Traders often use crossovers of short- and long-term moving averages as signals for trend, entry, and exit points. For example, a day trading strategy might plot 5-period and 20-period EMAs: when the 5-EMA crosses above the 20-EMA (with both above a longer 50-EMA), it can trigger a buy, and the reverse for sell signals. Because EMAs give more weight to recent prices, they react faster to price swings than SMAs, making them popular for intraday use.
All moving averages are lagging indicators. That is, they tell you where the price has been, not exactly where it will go. In fact, the optimal trade entry often passes before the moving average shows a trend change.
In practice, MAs work best in strongly trending markets. In range-bound or volatile conditions, they can whipsaw. For day traders, moving averages are a reliable trend filter, but they should be combined with other signals to make more informed trading decisions. One excellent method is to combine with Fibonacci trading strategies, where a crossover of a moving average above or below one of the Fibonacci levels can point out the market direction.
What to rememmber: When using Moving Averages, always look at multiple timeframes — a short-term MA (like the 20-period) helps spot quick momentum shifts, while a longer-term MA (like the 50 or 200) shows the bigger trend. Aligning your trades with the direction of the longer-term MA can significantly improve your trade setups and reduce false signals.MACD (Moving Average Convergence Divergence)
MACD is a versatile trend-and-momentum indicator. It’s computed as the difference between a short EMA (often 12-period) and a long EMA (often 26-period), with a 9-period EMA of that difference plotted as a signal line.
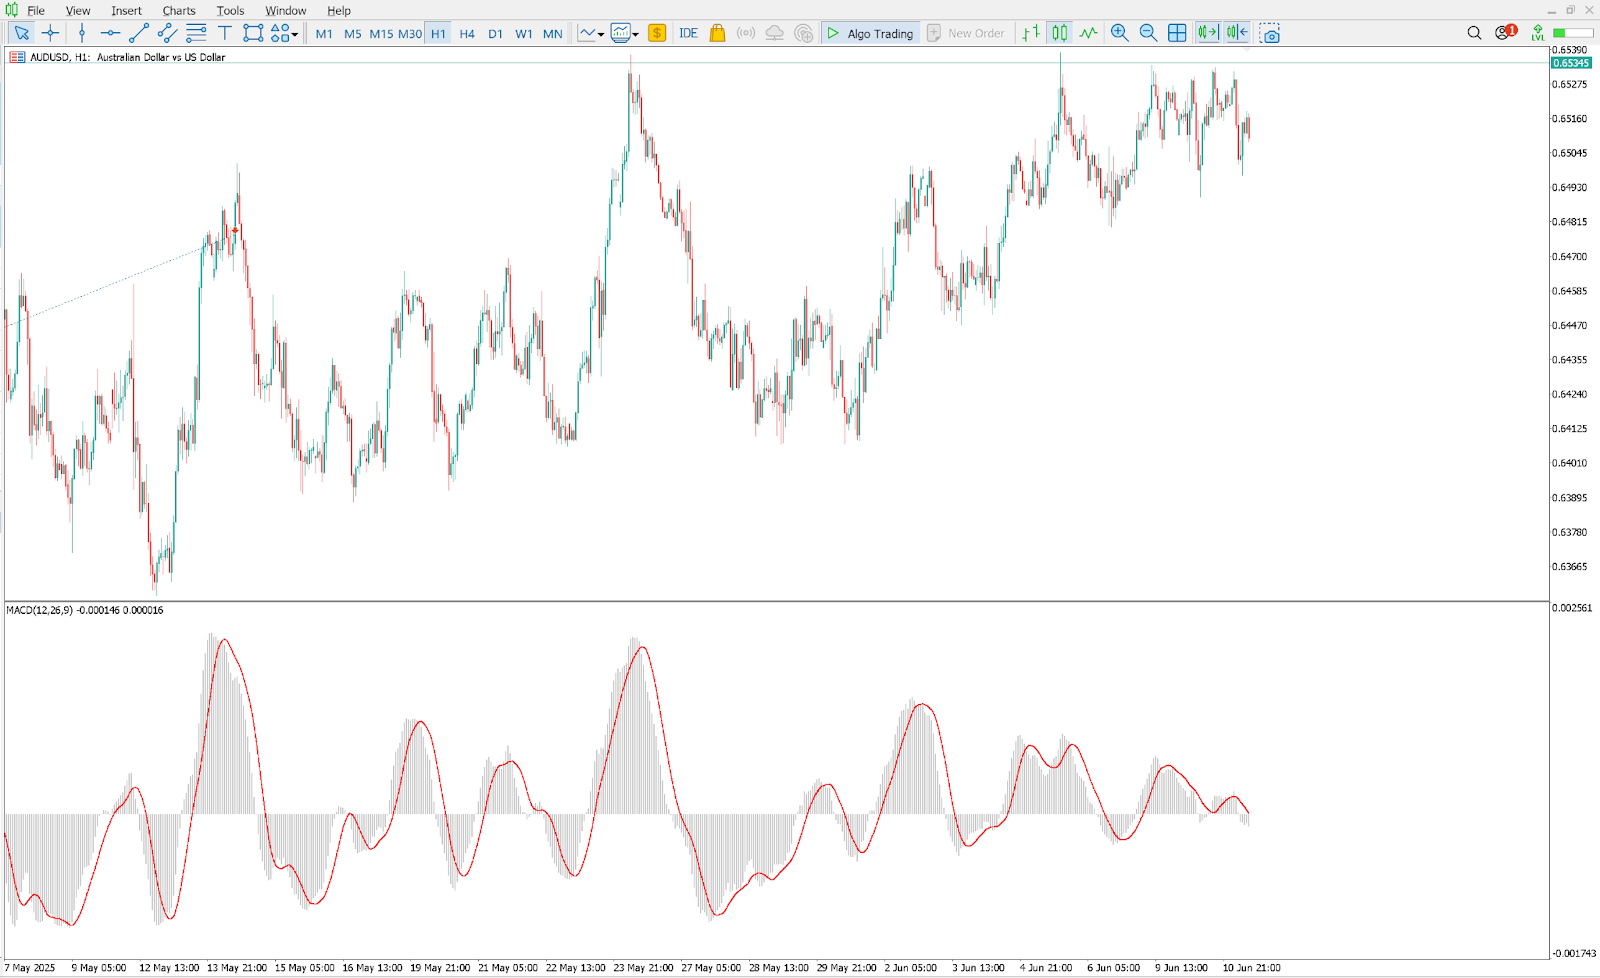
On a chart, you see two lines (MACD line and the signal line) and usually a histogram. When the MACD line crosses above the signal line, it’s a bullish cue (price momentum rising); when it crosses below, it’s bearish. Also, a MACD value above zero indicates the short EMA is above the long EMA, and below zero indicates a downtrend.
How to Use MACD for Day Trading
Day traders use MACD crossovers to time entries and exits, and watch the histogram for the strength of moves. A key strength of MACD is spotting divergences: for example, if the price makes a new high but MACD fails to, it suggests waning momentum and a potential trend reversal. In fact, many experts hail MACD as one of the most accurate forex indicators, since it blends trend-following and momentum in one tool.
The caveat is that MACD is still based on moving averages, so it lags price. In a fast intraday move, MACD may generate signals slightly after the move has begun. Still, its ease of interpretation and the clear bullish/bearish crossover make it a favorite for day trading.
What to Remember: When using the MACD, don't just focus on the crossover — pay close attention to the MACD histogram. Shrinking bars can be an early warning that momentum is fading, often signaling a potential reversal before the MACD lines actually cross. It’s a great way to stay ahead of the curve.Bollinger Bands
Bollinger Bands are a classic volatility indicator that helps traders spot overbought and oversold conditions, price squeezes, and potential breakouts. The bands consist of a middle line (usually a 20-period SMA) and two outer bands placed a certain number of standard deviations away from it (typically 2).

On your chart, they appear as three curved lines hugging the price. When price hugs the upper band, it may be overbought; when it hugs the lower band, it may be oversold. Price often oscillates between these bands, making them handy for anticipating reversals in range-bound markets.
How to Use Bollinger Bands for Day Trading
Day traders use Bollinger Bands to trade “the bounce” (price reverting back toward the middle band) or “the breakout” (price breaking above or below the bands with a volume spike). A common setup: when the bands contract (called a Bollinger squeeze), it signals low volatility and the potential for a sudden breakout.
They work well when paired with momentum indicators like RSI or MACD. For example, if price breaks below the lower band and RSI shows oversold, it could signal a high-probability bounce.
While not predictive on their own, Bollinger Bands are great for reading volatility and timing entries during consolidations or fakeouts.
What to remember: When using Bollinger Bands, watch for a squeeze, where the bands contract tightly — it signals low volatility and often precedes a sharp breakout. The key? Don’t predict the direction — wait for price to break above or below the bands to confirm the move before jumping in.On-Balance Volume (OBV)
On-Balance Volume (OBV) is a volume-based indicator that cumulatively adds volume on up-days and subtracts volume on down-days, capturing the net flow of money into an asset.

As you can see in the chart above, OBV appears as a running line that trends up when trading volume supports rising prices and trends down when volume accompanies falling prices.
How to Use OBV for Day Trading
Using the OBV is quite simple. As a volume indicator, traders use OBV to gauge buying or selling pressure. A rising OBV during a rally confirms strong buying interest, whereas a dropping OBV on a down move confirms selling.
Divergences are also watched: for example, if price makes a new high but OBV does not, it suggests the rally lacks volume support and may reverse.
Importantly, the actual level of OBV is meaningless. Only its slope and pattern matter. Its strength lies in confirming trends: when both price and OBV move together, the trend is likely sustainable. A weakening OBV trend amid rising prices can be an early warning sign.
What to remember: When using the On Balance Volume (OBV) indicator, watch for divergences between OBV and price action. If the price is making new highs but OBV isn’t following, it could signal weakening buying pressure and a potential reversal — a subtle clue that often shows up before price reacts.Stochastic Oscillator
The Stochastic Oscillator is a popular momentum indicator similar to RSI but often more sensitive. It compares the current close to the recent high-low range, oscillating between 0 and 100. It has two lines: %K (the faster line) and %D (a moving average of %K).
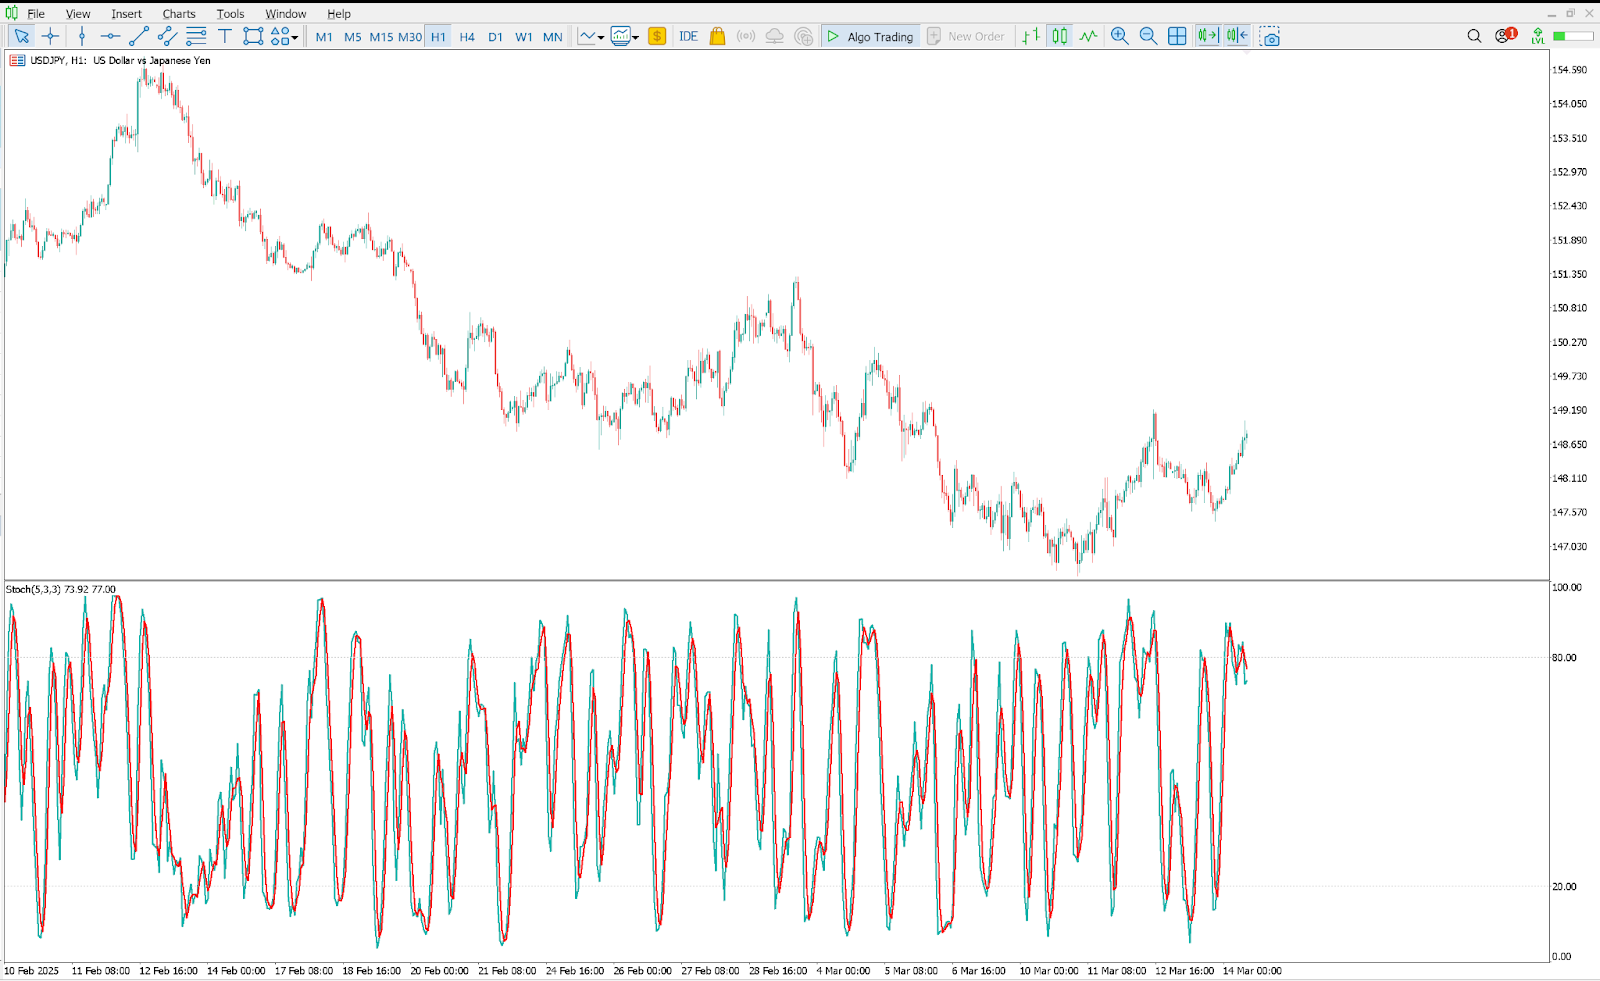
How to Use Stochastic Oscillator for Day Trading
Traders typically use 80 and 20 as thresholds: readings above 80 signal overbought conditions, and below 20 signal oversold. Crossovers of %K and %D generate signals: for instance, if %K crosses above %D from below 20, it suggests a buy, and vice versa for a sell above 80. Although, the same as the RSI, in trending markets, reading above or below 80 and 20 can signal a trend continuation rather than a reversal.
Because the stochastic is very sensitive, it can give an early warning of reversals. One key advantage is that it can turn downward even while the price is making new highs, alerting to a possible trend change before the price peak is obvious.
As with RSI, it’s wise to use stochastic signals in the context of the bigger trend or with confirmation from another indicator.
What to remember: When using the Stochastic Oscillator, don’t just trade every overbought (above 80) or oversold (below 20) signal — in trending markets, these levels can stay extreme for long periods. Instead, look for bullish or bearish divergences and use Stochastic crossovers in combination with trend confirmation for higher-probability setups.ATR (Average True Range)
Average True Range (ATR) is a volatility indicator, not a direction indicator. It computes the average of the “true range” (usually the high-low range or gaps) over a set period.
On a chart, it appears as a line that rises when market volatility increases and falls when volatility subsides.
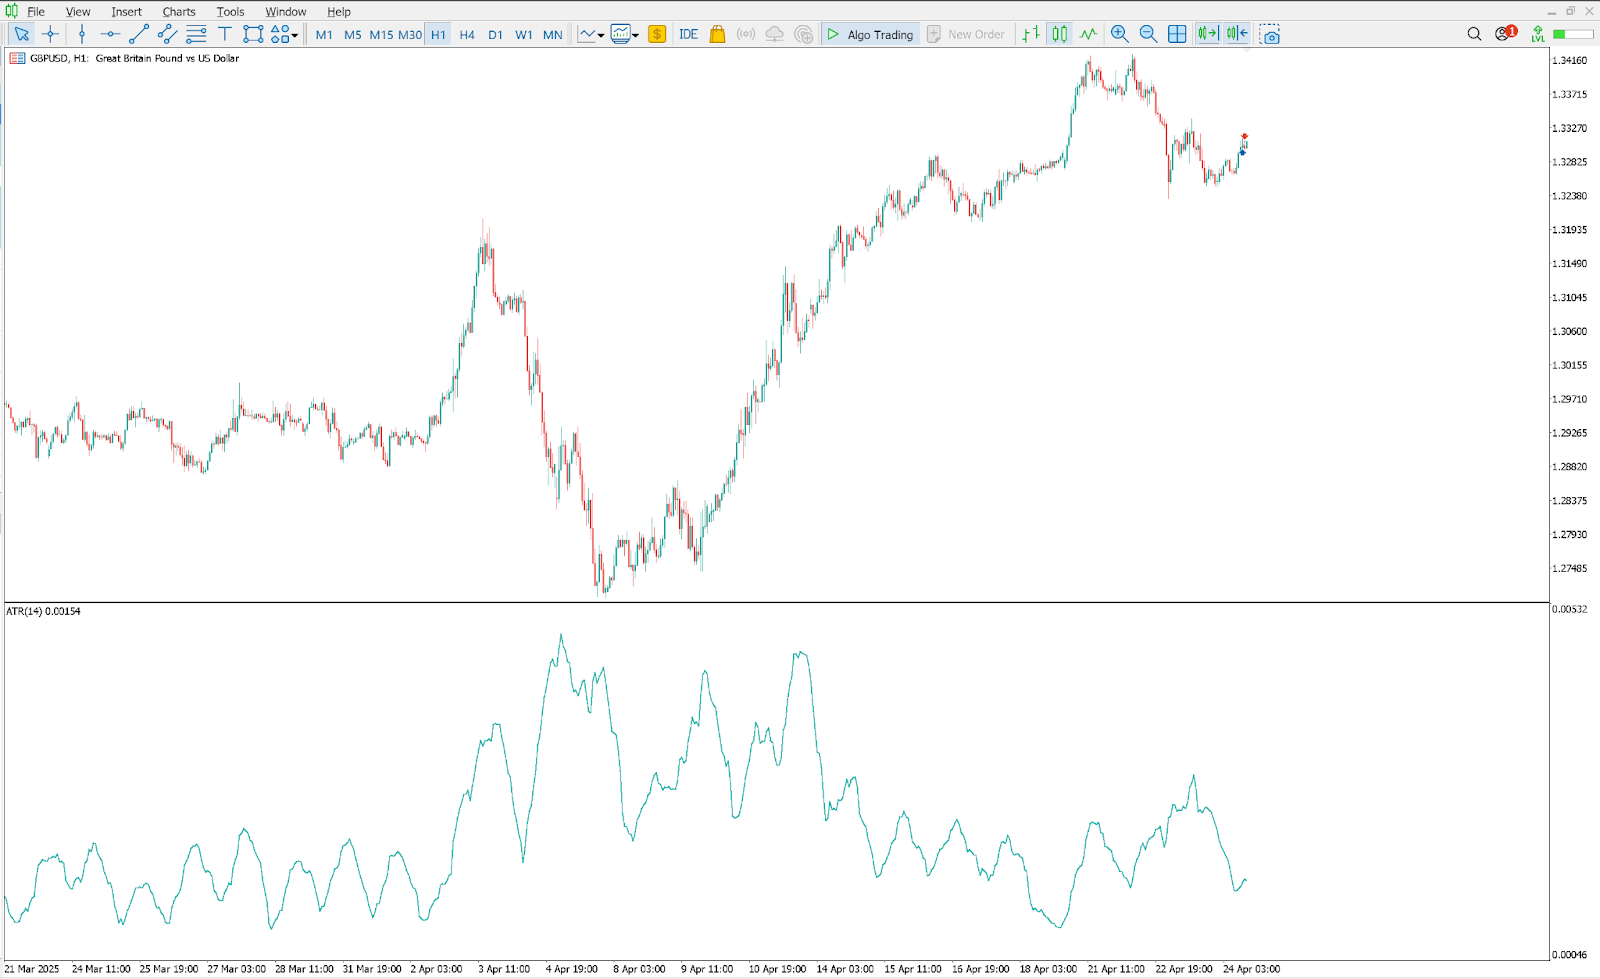
How to Use Average True Range for Day Trading
Day traders use ATR to gauge how much a currency or an asset typically moves in a session. A rising ATR signals large swings and breakout potential, while a low ATR signals a quiet market.
On a day-to-day basis, traders often use ATR to size stops and targets or to filter trades. For example, a trader might require that ATR be above a certain threshold before taking a trade, ensuring there is enough volatility to reach a profit target. Some set stops a multiple of ATR below entry to adapt to current volatility. Due to its simplicity and effectiveness, it's often used as an algo trading technique.
What to remember: Use the Average True Range (ATR) to set smarter stop-loss levels — rather than fixed pip amounts, base your stops on the current market volatility shown by the ATR. This helps you avoid getting stopped out by normal price fluctuations while keeping your risk in line with market conditions.Final Words
Day trading is all about speed and precision. Without the right tools, it’s easy to get lost in the noise. And by tools, we are referring to indicators. While these indicators won’t hand you winning trades on a silver platter, they will help you make smarter, faster decisions and improve your risk management.
As we have pointed out in this article, the best setups come from combining different perspectives. A trend indicator shows you where the market is headed. A momentum tool tells you how strong that move is. Volume confirms whether the move has real backing. So, combining them together gives you enough context to frame your best trade.
However, you don’t want to be that person with hundreds of indicators on their screens. Just a few well-chosen indicators and you’ll be just fine.
Don’t stop here. Keep testing, keep tweaking, and stay curious. With the right tools and mindset, you won’t just react to price... you’ll learn to read between the lines. That’s where the real edge lives.
FAQs
Before we wrap up, let’s tackle some of the most common questions traders ask about indicators.
What is the best volume indicator for day trading?
Although there are excellent volume indicators like the volume weighted average price (VWAP), traders often point to On-Balance Volume (OBV) as the best volume-based indicator in day trading. OBV accumulates volume on up vs. down days, revealing whether buyers or sellers are dominant. So, if a lot of traders point to OBV, maybe it’s the best then.
What is the most accurate indicator for day trading?
There is no single “most accurate” indicator in all situations, but a leading candidate is the MACD. It is often cited as highly reliable because it captures both trend and momentum. However, in practice, no indicator guarantees perfect timing, so using them in concert is key.
What is the best day trading indicator for divergence?
Indicators that measure momentum are best for spotting divergence. In particular, the MACD and RSI are commonly used for this purpose. If both MACD and RSI show the same divergence against price, the signal is stronger. Ultimately, any oscillator that reflects shifts in momentum (e.g., stochastic too) can be used to detect divergence, but MACD and RSI are the most popular.
Risk Disclosure: The information provided in this article is not intended to give financial advice, recommend investments, guarantee profits, or shield you from losses. Our content is only for informational purposes and to help you understand the risks and complexity of these markets by providing objective analysis. Before trading, carefully consider your experience, financial goals, and risk tolerance. Trading involves significant potential for financial loss and isn't suitable for everyone.