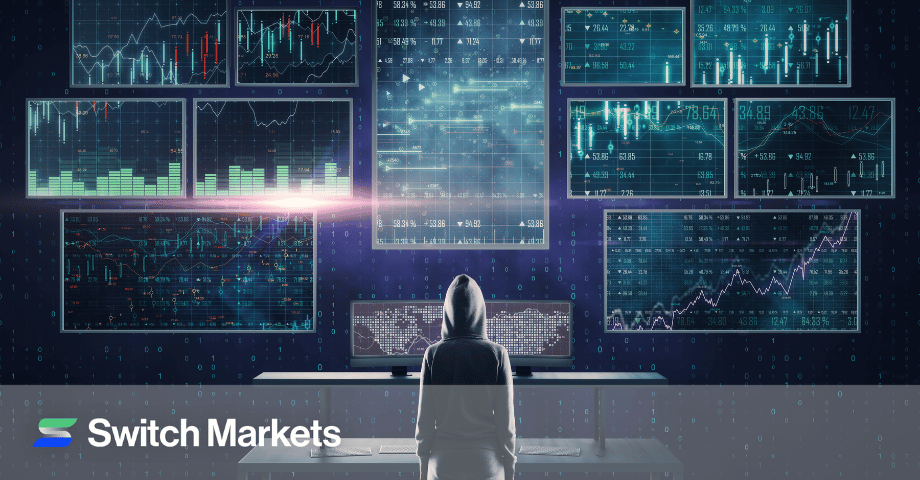
How to Read & Trade the Economic Calendar
Financial markets are constantly reacting to economic news, from inflation reports to jobs data and central‑bank announcements. These scheduled economic events are catalysts for volatility and offer both opportunity and risk.
A reliable economic calendar helps traders and investors track upcoming news events and anticipate market moves.
So, in this guide, we will show you how to read and trade the economic calendar effectively, and list the most important indicators and events you should watch out for.
What Is an Economic Calendar?
An economic calendar is a schedule of upcoming economic events, data releases, and announcements that are expected to influence financial markets. It is a key part of fundamental analysis as it helps investors value the intrinsic value of different assets.
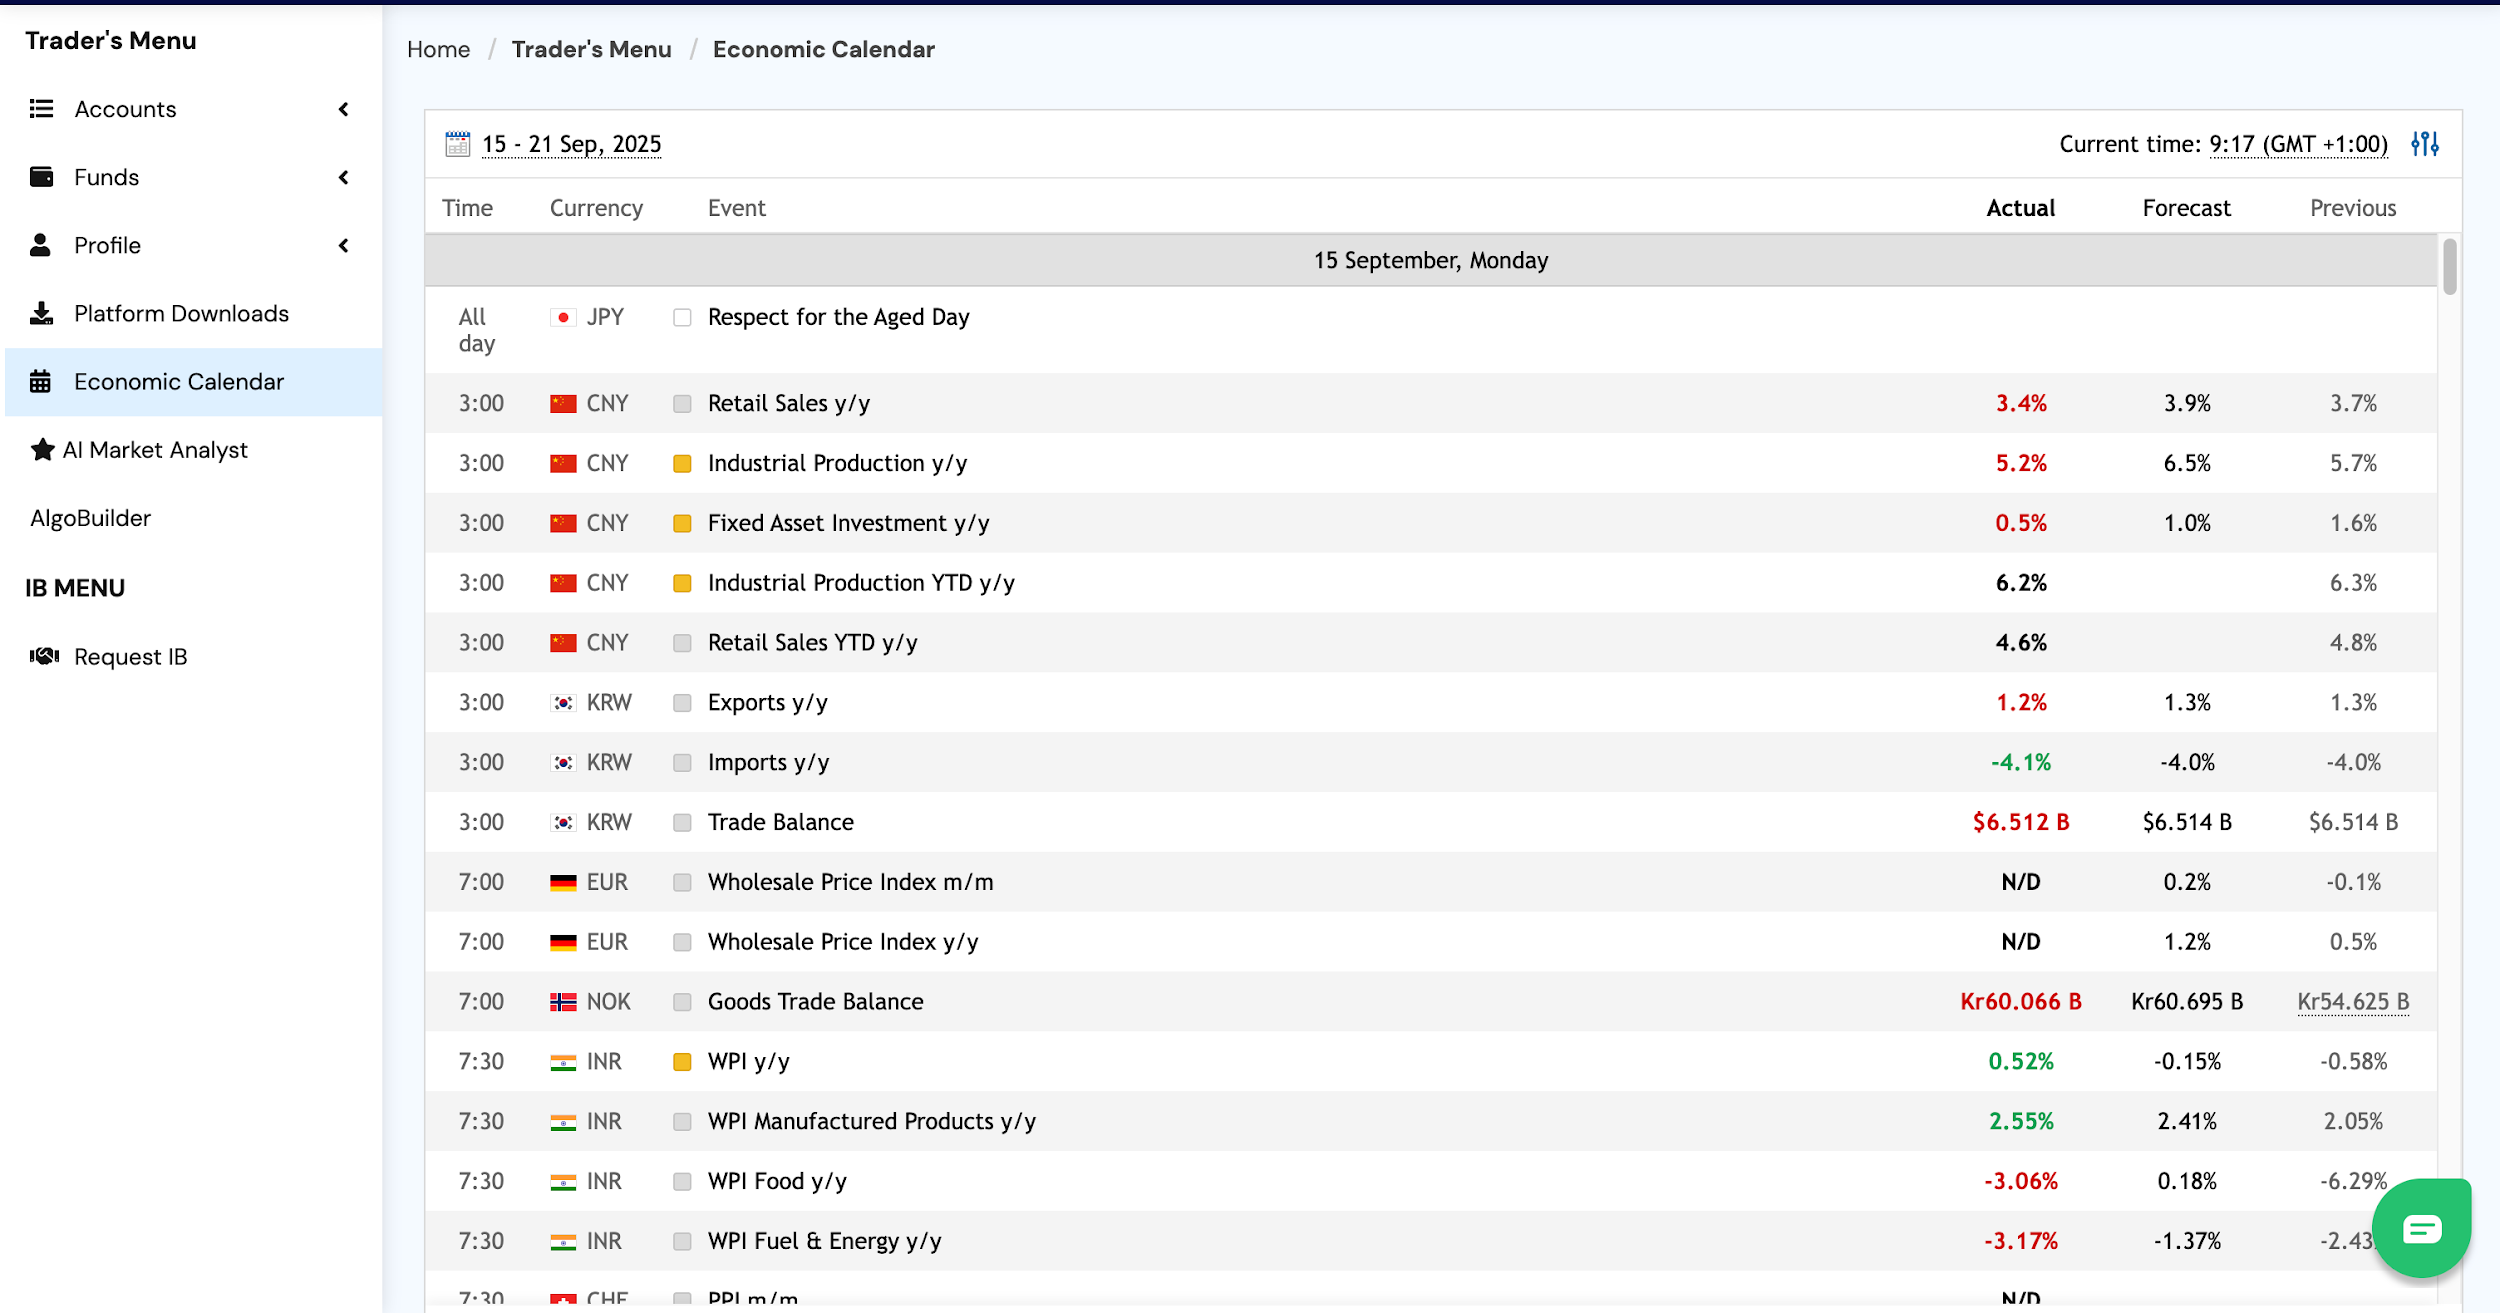
These calendars list events by date and time, include the currency or country affected, rate each event’s expected impact (often with a star or colour code), and provide a brief description of the event. They display the actual value, forecast value, and previous value for each data release.
Another way to look at the economic calendar is to see it as a tool that shows historical data, market consensus, and impact indicators so that traders can anticipate market reactions. By aggregating this information, the calendar becomes a central reference for economic indicators, metrics that measure the health of a global economy, such as GDP, inflation, and employment.
A good calendar allows filtering by date range, country, category (e.g., inflation, employment, central‑bank policy), and impact level. Events can be sorted by importance so that high‑impact items stand out.
Components of an Economic Calendar
Economic calendars typically include the following columns or fields:
Understanding these columns allows you to interpret the significance of a release. If the actual figure deviates significantly from the forecast, markets may react strongly. Larger differences often lead to bigger price moves, a point emphasised in the U.S. Non‑Farm Payroll (NFP) discussion below.
The importance rating helps prioritize which events deserve your attention; high‑impact releases are more likely to produce volatility in the forex market, stock market, and other global markets.
Why Should You Always Track the Economic Calendar?
Now that you know what an economic calendar is, the next step is understanding why it matters. Let’s explore why staying on top of upcoming announcements can make or break your trades.
Anticipating Market Volatility
Market prices often spike when unexpected economic data hits the news. For instance, economic data releases such as inflation, employment, and central‑bank announcements are powerful catalysts.
Keeping an eye on an economic calendar helps you anticipate volatility and plan trades accordingly.
For example, if a high‑impact event like the U.S. CPI is scheduled, a trader can decide to stay on the sidelines until after the data is released or adjust position sizes to manage risk.
Improved Risk Management and Timing
Economic calendars are not just about identifying opportunities; they are also crucial for risk management.
It is important to note that a calendar lists the date, time, description, and historical data for each event. This allows traders to manage positions ahead of releases.
As a result, it provides the trader with efficient information gathering, timely decision‑making, risk management, and volatility awareness. In other words, knowing when events are scheduled can help you time entries and exits to align with or avoid periods of high volatility.
Strategic Planning and Informed Decisions
Beyond the immediate trading implications, tracking upcoming economic events informs long‑term trading strategy. It is a known fact that an economic calendar provides insights into macroeconomic trends like GDP growth, inflation rates, and employment data. This helps traders and investors gauge the global economy’s health and adjust portfolios accordingly. For instance, long-term traders who often use the carry trade strategy must regularly check the economic calendar in order to evaluate changes in interest rates.
With this knowledge, you can make informed trading decisions rather than reacting to headlines.
Must‑Watch Economic Calendar Events for Traders
Not all releases are created equal; some events regularly send shockwaves through the financial markets. Below are major categories and specific indicators to watch. These events frequently appear on the economic calendar and have a significant market impact.
Inflation Data: Consumer Price Index (CPI) and Producer Price Index (PPI)
Inflation metrics gauge changes in consumer prices and production costs and are closely monitored by central banks.
The Consumer Price Index (CPI) measures the monthly change in prices for a basket of goods and services. It is a weighted average that represents aggregate consumer spending, compiled from roughly 80,000 price quotes collected each month.
Because CPI is widely used to track inflation and deflation, it can have a direct impact on interest rates. Policymakers and financial markets' participants watch the data to gauge whether monetary policy should tighten or loosen.
Inflation that is higher than expected can prompt central banks to raise interest rates, strengthening the domestic currency. Conversely, weak inflation often leads to rate cuts.
The Producer Price Index (PPI) measures inflation at the wholesale level and tracks price changes producers receive for their output. Unlike CPI, which measures consumer prices, PPI looks at price changes for producers and is considered a leading indicator of consumer inflation.
The index is published monthly by the U.S. Bureau of Labor Statistics and can forecast inflation trends before they appear in consumer prices. A rising PPI may signal future increases in consumer inflation and thus potential monetary tightening.
It's worth noting that every central bank regularly publishes data for the respective country/region. This data can impact FX currency rates, stock indices, and commodities.
Employment Data: Non‑Farm Payrolls (NFP) and Unemployment Rate
The U.S. Non‑Farm Payroll (NFP) report is one of the most significant monthly releases for traders. NFP is a key data point because it provides an indication of job growth. It is usually released at 8:30 a.m. Eastern Time on the first Friday of each month.
Traders focus on how the actual figure compares with the consensus estimate; larger deviations can lead to big moves in currency pairs like EUR/USD, GBP/USD, USD/JPY, and more.
The report often includes revisions to previous months’ numbers, so keep an eye on these adjustments as they can also sway market sentiment. The unemployment rate and average hourly earnings are additional components that influence the Federal Reserve’s policy decisions.
The economic calendar also lists unemployment releases for other countries. Let’s quickly point out here that higher unemployment tends to weaken a currency, while lower unemployment strengthens it.
Regular unemployment data from the eurozone, the United Kingdom, Australia, and Canada provide insights into labour‑market conditions and can cause volatility in related currency pairs.
Gross Domestic Product (GDP)
Gross Domestic Product (GDP) measures the total value of goods and services produced within an economy.
A strong GDP growth rate generally signals economic expansion and is positively correlated with corporate profits and investor risk appetite.
Conversely, strong GDP growth can make bonds less attractive because rising growth may lead to higher interest rates. GDP is not considered a leading indicator; markets track it relative to previous reports and consensus expectations.
Quarterly GDP releases from the United States (released by the Bureau of Economic Analysis), Eurozone (Eurostat), United Kingdom (ONS), and other major economies often result in large moves in currency pairs and stock indices.
Central‑Bank Interest Rate Decisions and Policy Statements
Interest rate changes and central‑bank communications are among the most influential key economic events as they can have a profound impact on currency exchange rates and bond yields.
Traders monitor not only the rate decision (hike, cut, or hold) but also the accompanying statement and press conference to gauge the future policy trajectory. A hawkish tone may lead to currency appreciation, while dovish guidance can trigger depreciation.
Major central‑bank meetings include the Federal Reserve’s Federal Open Market Committee (FOMC), the European Central Bank (ECB) Governing Council, the Bank of England Monetary Policy Committee (MPC), the Bank of Japan policy board, and others. A good economic calendar will label these events with high impact; adjustments in interest rates can influence all asset classes, including forex,the stock market, bonds, and commodities.
Retail Sales and Consumer Spending Data
Retail sales figures measure consumer spending, a key driver of economic growth. The U.S. retail sales report, released quarterly, helps assess consumer confidence and its potential impact on currency values. Strong retail sales may signal robust economic activity, prompting expectations of interest‑rate hikes and currency strength, while weak sales can produce the opposite effect.
Other countries’ retail sales releases, such as the U.K.’s Office for National Statistics or Australia’s ABS, offer similar clues.
Purchasing Managers’ Index (PMI) Surveys
PMI surveys gauge business sentiment in the manufacturing and services sectors. A lot of professional traders include ISM Manufacturing PMI (United States), German Flash Manufacturing PMI, and other sector surveys among their watchlists. PMI readings above 50 indicate expansion; below 50 indicate contraction. Changes in PMI can foreshadow shifts in GDP and industrial production, making them important forward‑looking indicators.
Other Noteworthy Events
The economic calendar contains numerous other indicators. Most economic calendars often list other events like core retail sales, central‑bank meeting minutes (e.g., ECB, Bank of England), the Treasury currency report, and the Core PCE Price Index.
They can also include JOLTS Job Openings for U.S. labour‑market insight, employment indicators like ADP payrolls and weekly jobless claims, manufacturing and services PMIs, inflation expectations data, crude oil inventories, and election dates.
Traders should tailor their watchlist to their portfolios; for example, commodity traders might focus on energy inventories, the WASDE reports, the CFTC, and Chinese industrial production. Stock traders must focus on earnings results.
Keeping track of economic events ensures you’re prepared for shifts in market conditions and can adjust your strategy effectively. Don't avoid it; you must check the econmic calendar every day to stay informed and know the key fundamentals that might impact the markets. How to Read the Economic Calendar
Once you know which events matter, learning to use the economic calendar efficiently ensures you extract the right information.
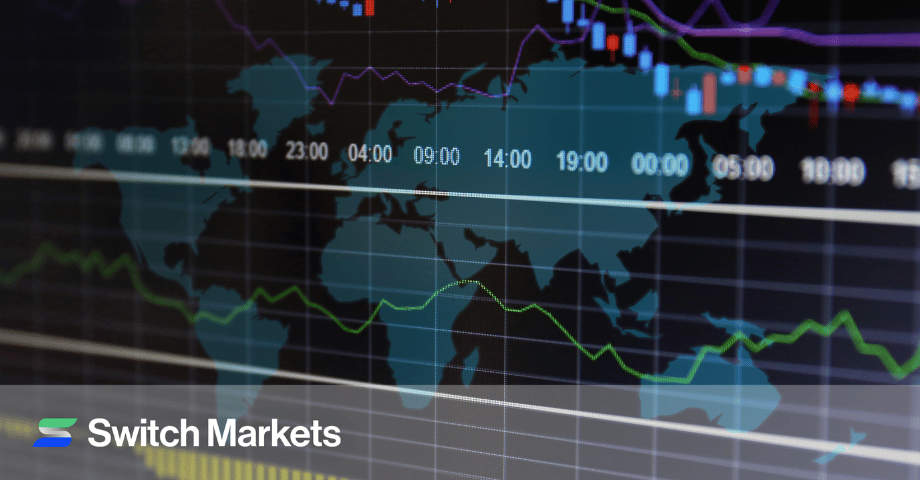
Adjust Time Zone and Filters
Most calendars allow you to select your time zone so that release times are automatically converted. If this is not done, reading the economic calendar can be very confusing. So, you can apply filters by country, event category, and impact level.
Ensure you choose only the currencies and categories relevant to your trades to avoid noise.
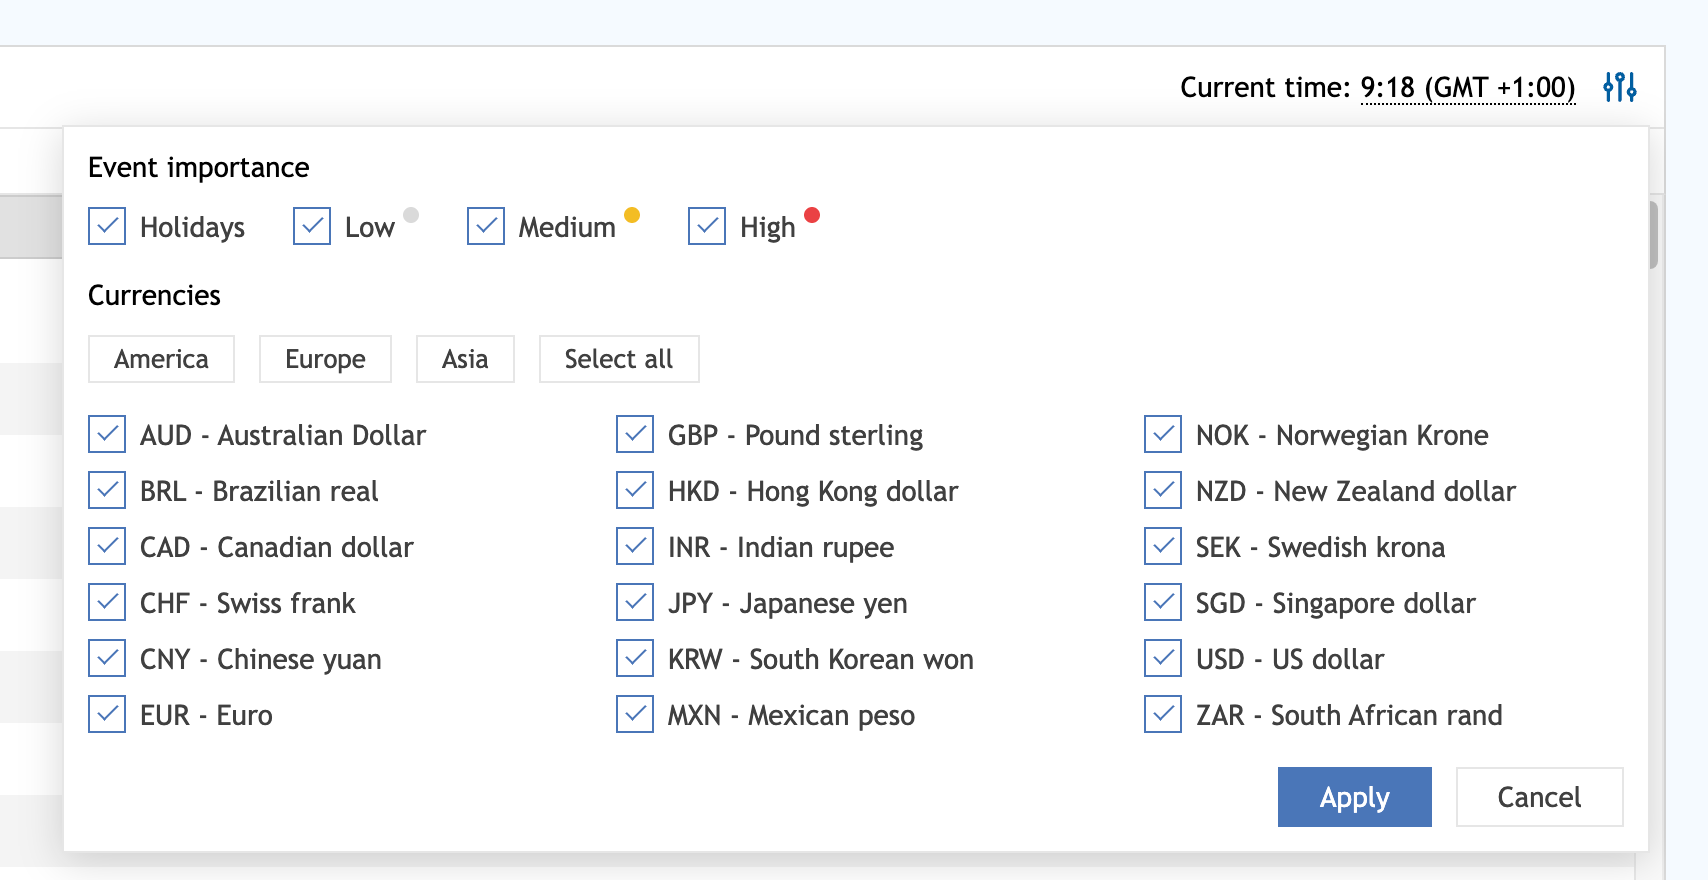
Interpreting Impact Ratings
Events are often tagged with impact ratings (low, medium, high). High‑impact releases like CPI, NFP, or central‑bank decisions can cause large price swings.
Medium‑impact events may cause moderate volatility, while low‑impact ones often have little effect.
It is important to note that traders sometimes fear high‑impact events, but those are often the most profitable to trade. Use the impact filter to focus on events that match your risk tolerance and strategy.
Understanding Forecast, Actual, and Previous Figures
The forecast (consensus estimate) reflects market expectations. The actual value is the released figure. The previous value provides a baseline for comparison.
Investors compare the actual value to the consensus forecast; red numbers indicate the actual is lower than the forecast, green indicates higher. Deviations between actual and forecast drive market reactions.
For instance, if NFP is much stronger than expected, the U.S. dollar often appreciates; if weaker, it tends to decline.
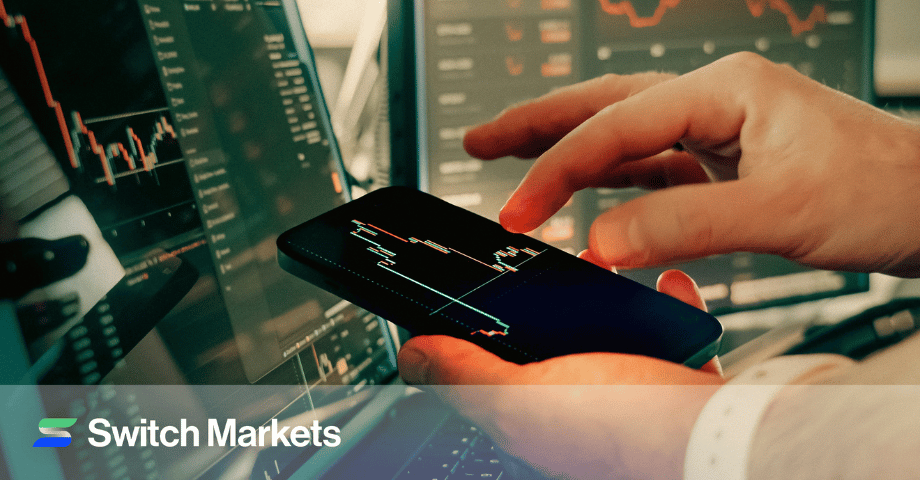
How to Trade the Economic Calendar
Armed with the knowledge of what events to watch and how to read them, the next step is executing trades around these events. There are two primary approaches: trading the news and waiting for confirmation.
Trading the News
This approach involves entering trades immediately before or after a major release to capture the initial volatility. Traders generally monitor expected versus actual figures; a significant surprise can lead to rapid price moves. This method is typically more suited for scalpers who are looking for a quick, sharp move immediately during or after the release.
To trade the news effectively:
- Prepare: Note the release time, consensus estimate, and potential scenario outcomes.
- Use fast execution: A small delay can turn a profitable move into a loss. Ensure your trading platform supports fast order entry and that you have reliable internet. For a reliable market execution, it's highly recommended to use a VPS.
- Monitor all data points: Focus on the headline figure but also watch secondary components (e.g., wage growth in NFP or core inflation in CPI) since they can offset the headline effect.
- Set stop‑loss: Volatility can cause sharp reversals. Protect your capital with tight stops and plan for slippage.
Trading news events carries high risk because price moves can reverse quickly. The initial market reaction may overshoot and then correct once participants digest the details. Only experienced traders with a high risk tolerance should consider this strategy.
Waiting for the Market to Settle
Many traders prefer to let volatility subside before entering a trade. In this case, it is better to wait 15–30 minutes after the data release to allow markets to digest the information. This approach has several advantages:
- Clearer trend direction: After the initial spike, markets often retrace to a support or resistance level. Entering on a pullback provides a better risk‑reward ratio.
- Reduced slippage: Lower volatility means less chance of price slippage on order fills.
- Technical confirmation: You can combine chart patterns, trendlines, or indicators with the fundamental signal to improve entry timing.
This method sacrifices the early portion of the move but often results in smoother trades with a higher probability of success.
Wrapping Up
The economic calendar is an indispensable tool for modern traders. It transforms a barrage of economic news into a structured timeline, enabling you to anticipate upcoming economic events, manage risk, and make informed trading decisions.
Knowing the significance of key indicators like consumer price index, producer price index, non‑farm payrolls, GDP, interest‑rate decisions, and employment data can tailor your trading strategy to capitalize on volatility or avoid it when necessary. A good trader cannot ignore the economic calendar, as it provides insights into the market direction and the future plans of central banks and policymakers.
Frequently Asked Questions (FAQs)
To clear up any confusion and make sure you’re fully equipped, here are answers to some common questions traders often ask about using the economic calendar effectively.
Should I trade during or after an economic news release?
Trading during a release can be profitable but carries high risk. We suggest waiting 15–30 minutes after the release for the market to settle before trading. Waiting allows you to identify clearer trends and reduces the chance of being caught in a whipsaw move.
What is the difference between CPI and PPI?
The Consumer Price Index (CPI) measures the monthly change in the prices consumers pay for a basket of goods and services. It is a widely used indicator of inflation and influences monetary policy. The Producer Price Index (PPI) measures price changes at the wholesale level, which producers receive for their goods.
Why is the Non‑Farm Payroll report important for traders?
The U.S. NFP report provides a monthly snapshot of job growth and is released on the first Friday of each month. Traders watch the difference between the actual figure and the consensus estimate because large deviations can trigger significant moves in currency pairs and stock indices.
Risk Disclosure: The information provided in this article is not intended to give financial advice, recommend investments, guarantee profits, or shield you from losses. Our content is only for informational purposes and to help you understand the risks and complexity of these markets by providing objective analysis. Before trading, carefully consider your experience, financial goals, and risk tolerance. Trading involves significant potential for financial loss and isn't suitable for everyone.