Bond Yields Explained: How They Move Global Markets
For many beginners, bond yields remain one of the most misunderstood corners of finance. The math feels intimidating, and the chain of cause and effect runs through several markets before it lands on the trading screen.
In this guide, we will cover what bond yields are, which bonds you should follow, and how their movements ripple through the dollar, equity indices, gold, and oil.
Everything here relates back to one idea: bond yields impact every other asset class, and reading them changes how you read the rest of the market.
By the end of this page, you will know how to use bond yields as a fundamental signal for the trading day rather than as a number flashing on a Reuters terminal.
What Are Bond Yields?
A bond is a loan. When a government or a company needs money, it issues a bond. You purchase that bond at a stated price (the par value), and in return, you receive periodic interest payments (the coupon) until the bond matures. On the maturity date, your principal is returned.
The yield is the return you actually earn, expressed as an annual percentage of the bond's current market price. The coupon is fixed at issue, so the yield moves up and down as the bond changes hands in the secondary market.
When investors sell bonds in size, prices fall, and yields rise. When demand for bonds is strong, prices rise, and yields fall.
Yields are quoted live through every trading day on Bloomberg terminals, Reuters pages, and government auction results. The US Treasury holds regular auctions (on Tuesday, Wednesday, and Thursday across the month) where the secondary market establishes the going rate for each maturity.
Historical data going back decades is available free of charge from the FRED database, where you can search for any maturity and pull the chart. Money market funds, bond ETFs, and institutional investment desks use the same numbers, so retail traders look at the same prices the professionals do. Bond yields are a key part of fundamental analysis for all financial assets, as they directly affect interest rates.
The Yield Curve Explained
Treasury securities are issued across a range of maturities from 4-week bills to 30-year bonds. Plot the yields of those securities from shortest to longest, and you get the yield curve.
The yield curve takes three classic shapes:
- Normal
- Flat
- Inverted
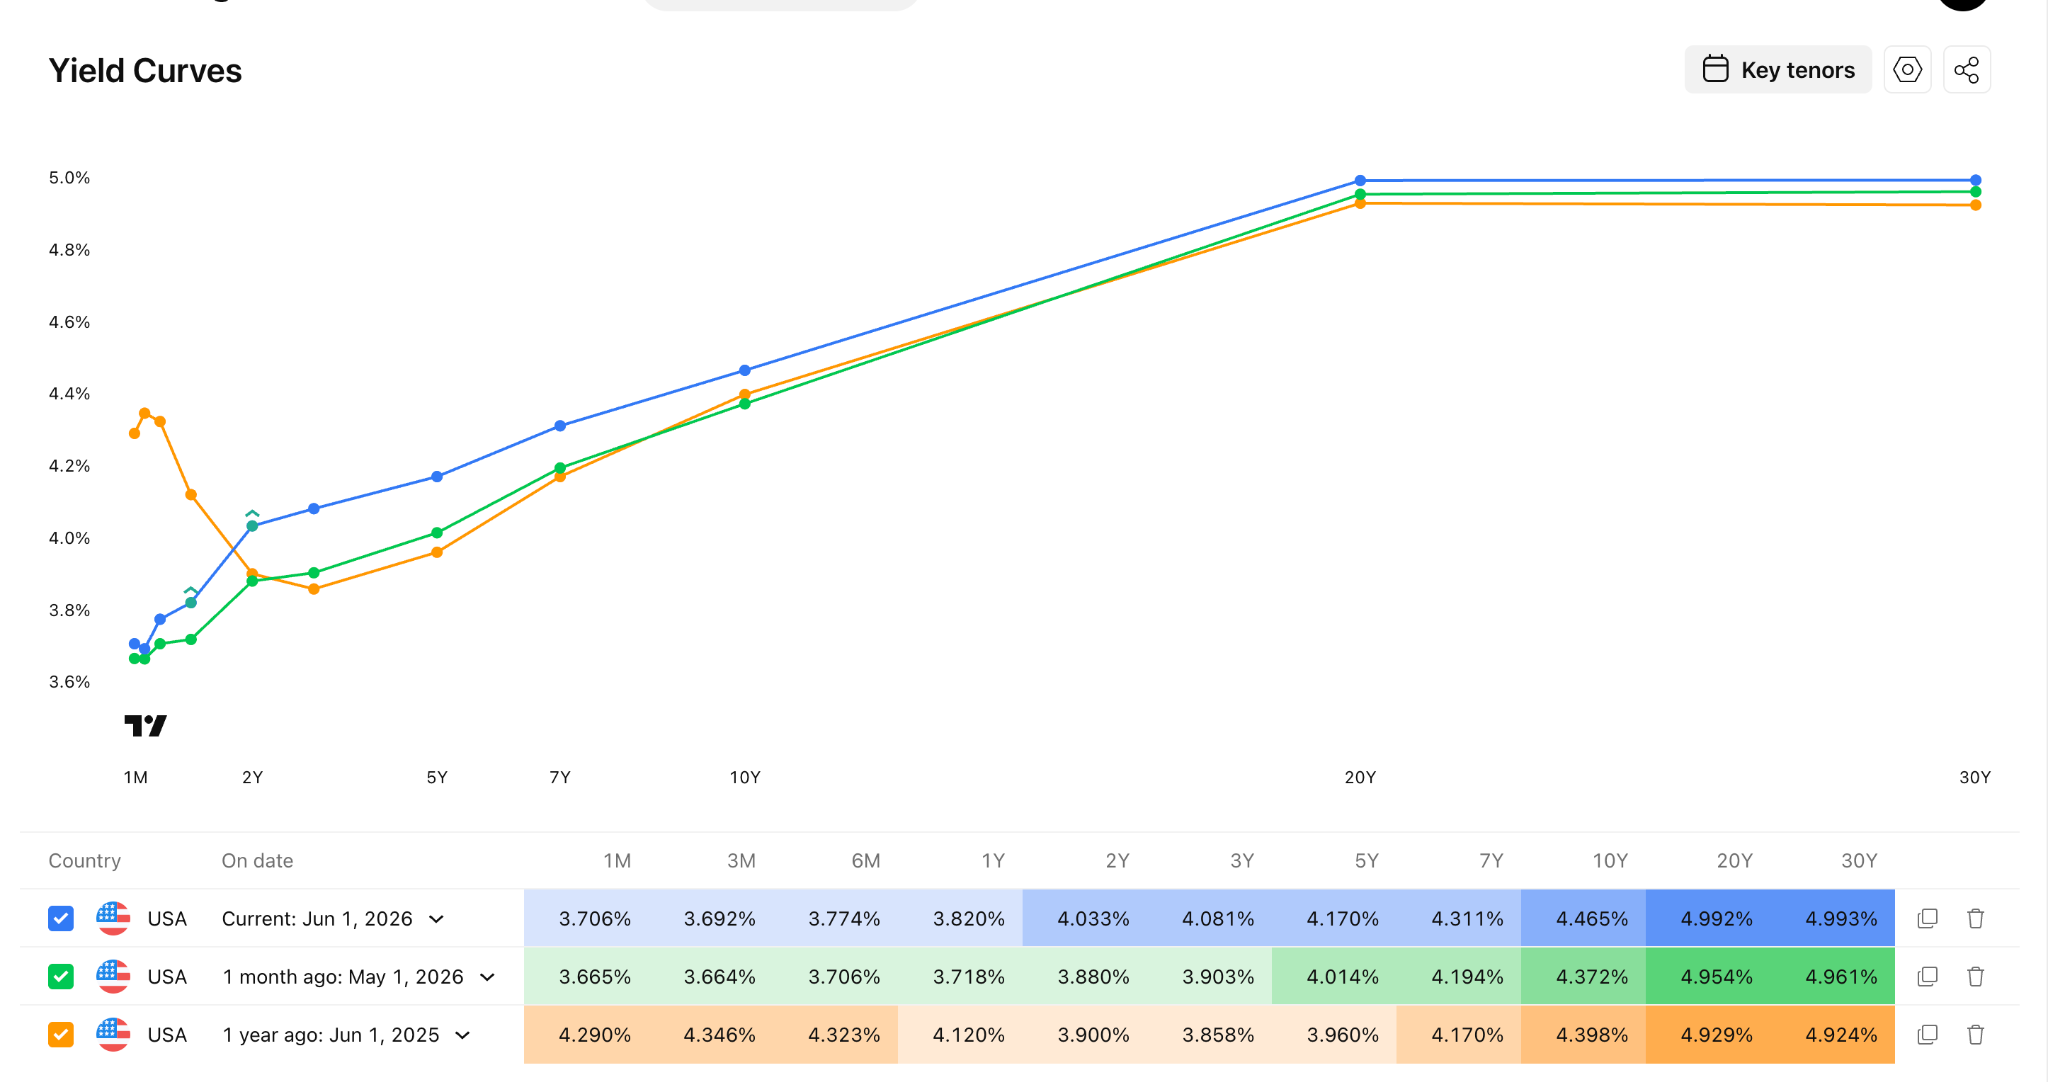
A normal curve makes intuitive sense. Investors demand more interest to lend money for longer, so long maturities yield more than short ones. When the curve inverts, something unusual is happening: the market is pricing in lower future rates because it expects the central bank to cut aggressively in response to slowing growth.
An inverted yield curve has preceded every US recession since the mid-1970s, although the lag time varies from a few months to over two years. The most recent significant inversion lasted from 2022 to late 2024, before the curve returned to its normal shape.
As of late June 2026, the US 10-year yield sits near 4.67% while the 2-year yield trades around 4.09%. That produces a positive 2s10s spread of roughly 53 basis points, well clear of the inversion zone. Cleveland Fed estimate models built on this spread put recession probability within 12 months at moderate, not severe, levels.
What Bonds Should You Look At?
You do not need to track every government bond in the world. A handful of benchmark issues tells you almost everything important about the global rate environment.
The US 10-year Treasury yield is arguably the most important interest rate on the planet. Mortgages, corporate borrowing costs, and the valuation of every stock on earth are at least partly indexed to it.
How Bond Yields Move the Markets
Now we get to the part that matters for traders: what bond yields do to the other markets you actually trade.
1. Bond Yields and the US Dollar
The US dollar shares a positive correlation with US Treasury yields. The logic is simple: when US yields rise, dollar-denominated assets offer a better return than the alternatives in Europe, Asia, or emerging markets. Global capital chases that return, buys dollars to do so, and the dollar strengthens.
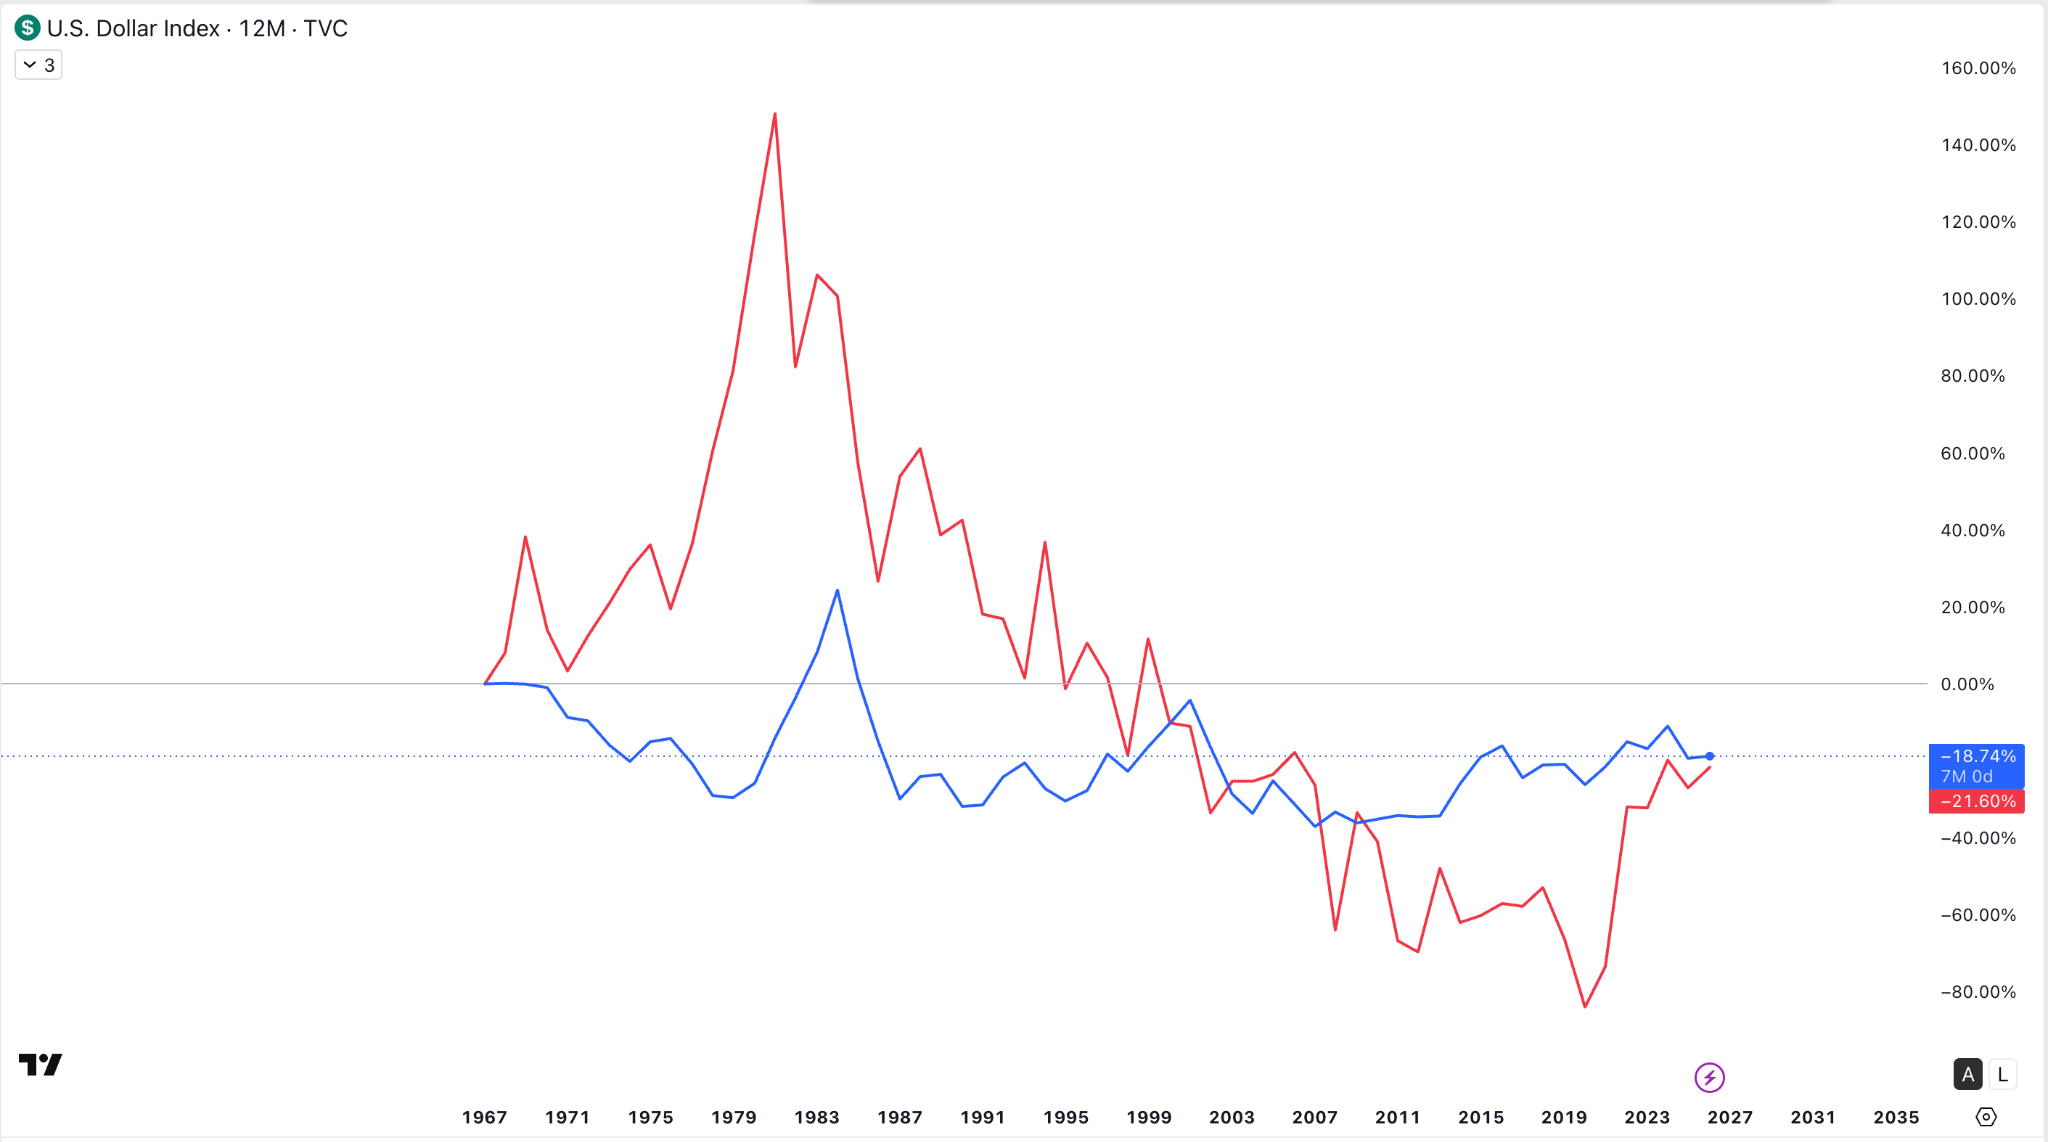
The clearest expression of this effect is the interest rate differential. When the US 10-year yields 4.67% and the German 10-year Bund yields around 2.6%, the 2-point spread pulls capital toward the dollar and pressures EUR/USD lower. The same logic applies to USD/JPY, where the gap between the US 10-year and the Japanese JGB is one of the most important drivers in all of forex.
There are exceptions. During genuine risk-off events, the dollar can strengthen even as yields fall, because investors flee into Treasuries themselves as a safe haven. In that state, Treasury prices rise (yields fall), and the dollar rises at the same time, and the textbook relationship temporarily breaks.
2. Bond Yields and Stock Indices
The relationship between bond yields and equity indices is one of the most important links in macro trading.
Every stock is theoretically worth the present value of its future cash flows. The discount rate used to bring those cash flows back to today is anchored by the 10-year Treasury yield. When the 10-year yield rises, the discount rate rises, and future earnings become less valuable today. Stock prices fall to reflect the new math.
This effect hits the longest-duration stocks hardest. A high-growth technology company earning most of its cash flow ten years out is far more rate-sensitive than a utility paying dividends today. That is why the Nasdaq 100 historically shows a more negative correlation with the 10-year yield than the Dow Jones Industrial Average does.
There is also a competing-asset effect. If Treasuries pay 4.7% with no credit risk, stocks must offer a meaningful premium above that, or capital rotates into bonds. When the S&P 500's earnings yield compresses close to the 10-year Treasury yield, the equity risk premium narrows, and stocks become structurally vulnerable.
The current backdrop shows the pattern clearly. In the trading week ending May 20, 2026, US 10-year yields pushed to a 16-month high near 4.7% on Middle East tensions and an energy-driven inflation shock, with the 30-year bond reaching an 18-year high above 5.2%. The S&P 500, the Nasdaq, and the Dow Jones all slipped on consecutive trading days as the bond market sold off.
3. Bond Yields and Gold
Gold has historically held an inverse relationship with bond yields, although recent years have complicated the picture. The textbook logic: gold pays no coupon and earns no interest. When real yields (nominal Treasury yields minus inflation) rise, the opportunity cost of holding gold rises with them, and money flows out of bullion into interest-bearing securities. When real yields fall, gold's appeal as a non-yielding store of value strengthens.
That relationship held tightly for nearly two decades until 2022. Central bank gold purchases, geopolitical risk after the war in Ukraine, and concerns about sovereign debt sustainability have kept gold bid even as yields climbed. The lesson is not that the correlation is dead, but that gold now responds to a wider mix of inputs than yields alone. For day-to-day or scalp trading, real yields (best tracked via the 10-year TIPS yield, often referred to as the inflation-indexed rate) remain a cleaner signal for gold than nominal yields.
4. Bond Yields and Commodities
Crude oil and Treasury yields often show a positive correlation during expansions. Strong economic growth lifts both oil demand and inflation expectations, and inflation expectations push yields higher. Recently, the causation has flipped: an energy-driven inflation shock from Middle East supply disruption has driven both oil prices and bond yields higher, with oil acting as the catalyst rather than the response.
Industrial metals such as copper tend to move with growth expectations and follow a similar pattern. Agricultural commodities are more weather-driven and less directly tied to yields.
How to Use Bond Yields in Your Trading
You do not need a fixed-income desk to put bond yields to work. A few simple habits make a big difference.
- Make the US 10-year yield chart part of your morning routine. Visit a Reuters page, TradingView, or Switch Markets' economic calendar before you place your first trade of the day.
- Watch the 2-year for Fed expectations. When the 2-year is rising fast, the market is pricing in a higher chance that the Fed will raise rates or hold them higher for longer.
- Use yield differentials for forex. Pair USD/JPY analysis with the US 10-year minus the Japanese JGB. Pair EUR/USD with the US 10-year minus the German Bund.
- Do not chase equity rallies that the bond market disagrees with. If yields are jumping and stocks are jumping at the same time, one of the two is likely to capitulate.
- Use the economic calendar. Treasury auctions on Tuesday, Wednesday, and Thursday, CPI prints, Non-Farm Payrolls, the September FOMC meeting, and similar events all move yields hard.
You can pull yield data and run forex, indices, and commodities setups side by side on a single chart through Switch Markets MT4 and MT5. Our economic calendar flags Treasury auctions, FOMC meetings, and CPI releases so you can plan your trading day around the moments yields are most likely to move.
Final Word
Bond yields are the engine room of global finance. The 10-year Treasury yield sets the discount rate for every equity, anchors mortgage and corporate borrowing costs, drives capital flows between currencies, and shapes the opportunity cost of holding gold.
You do not need to trade bonds to benefit from understanding them. You just need to learn to read them. Once you do, the moves in the dollar, the indices, and gold stop looking random. They start looking like the predictable downstream result of a single, observable variable.
Start by adding the US 10-year yield to your daily chart routine, then layer in the 2-year and the Bund-Treasury spread. Over the coming months, the difference in your reading of the markets will surprise you.
FAQs
Here are some common questions about bond yields and trading:
What is the difference between a bond's coupon and its yield?
The coupon is the fixed interest payment the issuer agreed to pay when the bond was issued. It does not change. The yield is the return you actually receive based on the bond's current market price, which moves throughout the trading day.
Why do bond prices and yields move in opposite directions?
Because the coupon is fixed in dollar terms. If the price you pay for the bond falls, that fixed coupon represents a higher percentage of your purchase price so the yield rises. If the price you pay rises, the same coupon represents a smaller percentage, and the yield falls.
What does an inverted yield curve mean?
An inverted yield curve means short-term yields are higher than long-term yields. It signals that investors expect the central bank to cut interest rates in the future, usually in response to slowing growth or recession.
Risk Disclosure: The information provided in this article is not intended to give financial advice, recommend investments, guarantee profits, or shield you from losses. Our content is only for informational purposes and to help you understand the risks and complexity of these markets by providing objective analysis. Before trading, carefully consider your experience, financial goals, and risk tolerance. Trading involves significant potential for financial loss and isn't suitable for everyone.