Trading Fed Rate Probabilities: How to Use the CME FedWatch Tool to Gauge Market Sentiment
How to Use the CME FedWatch Tool - Listen to the Full Article
If you’ve ever wondered why the US dollar suddenly tanks after a press conference, or why gold spikes on a random Wednesday afternoon, chances are the Federal Reserve had something to do with it. And if you want to know what the market thinks the Fed is going to do next – before they actually do it – there’s one tool that practically every serious trader has bookmarked: the CME FedWatch Tool.
Think of it as a crystal ball for interest rate expectations. Except it’s not based on guesswork or gut feelings. It’s built on hard data from the futures market – specifically, 30-Day Fed Funds futures prices traded on the CME Group, one of the world’s largest derivatives exchanges.
In this guide, we’re going to break down what the CME FedWatch Tool is, how to read it, how to use it to gauge market sentiment, and why it’s one of the most valuable tools in any trader’s arsenal. Let’s get into it.
What Is the CME FedWatch Tool?
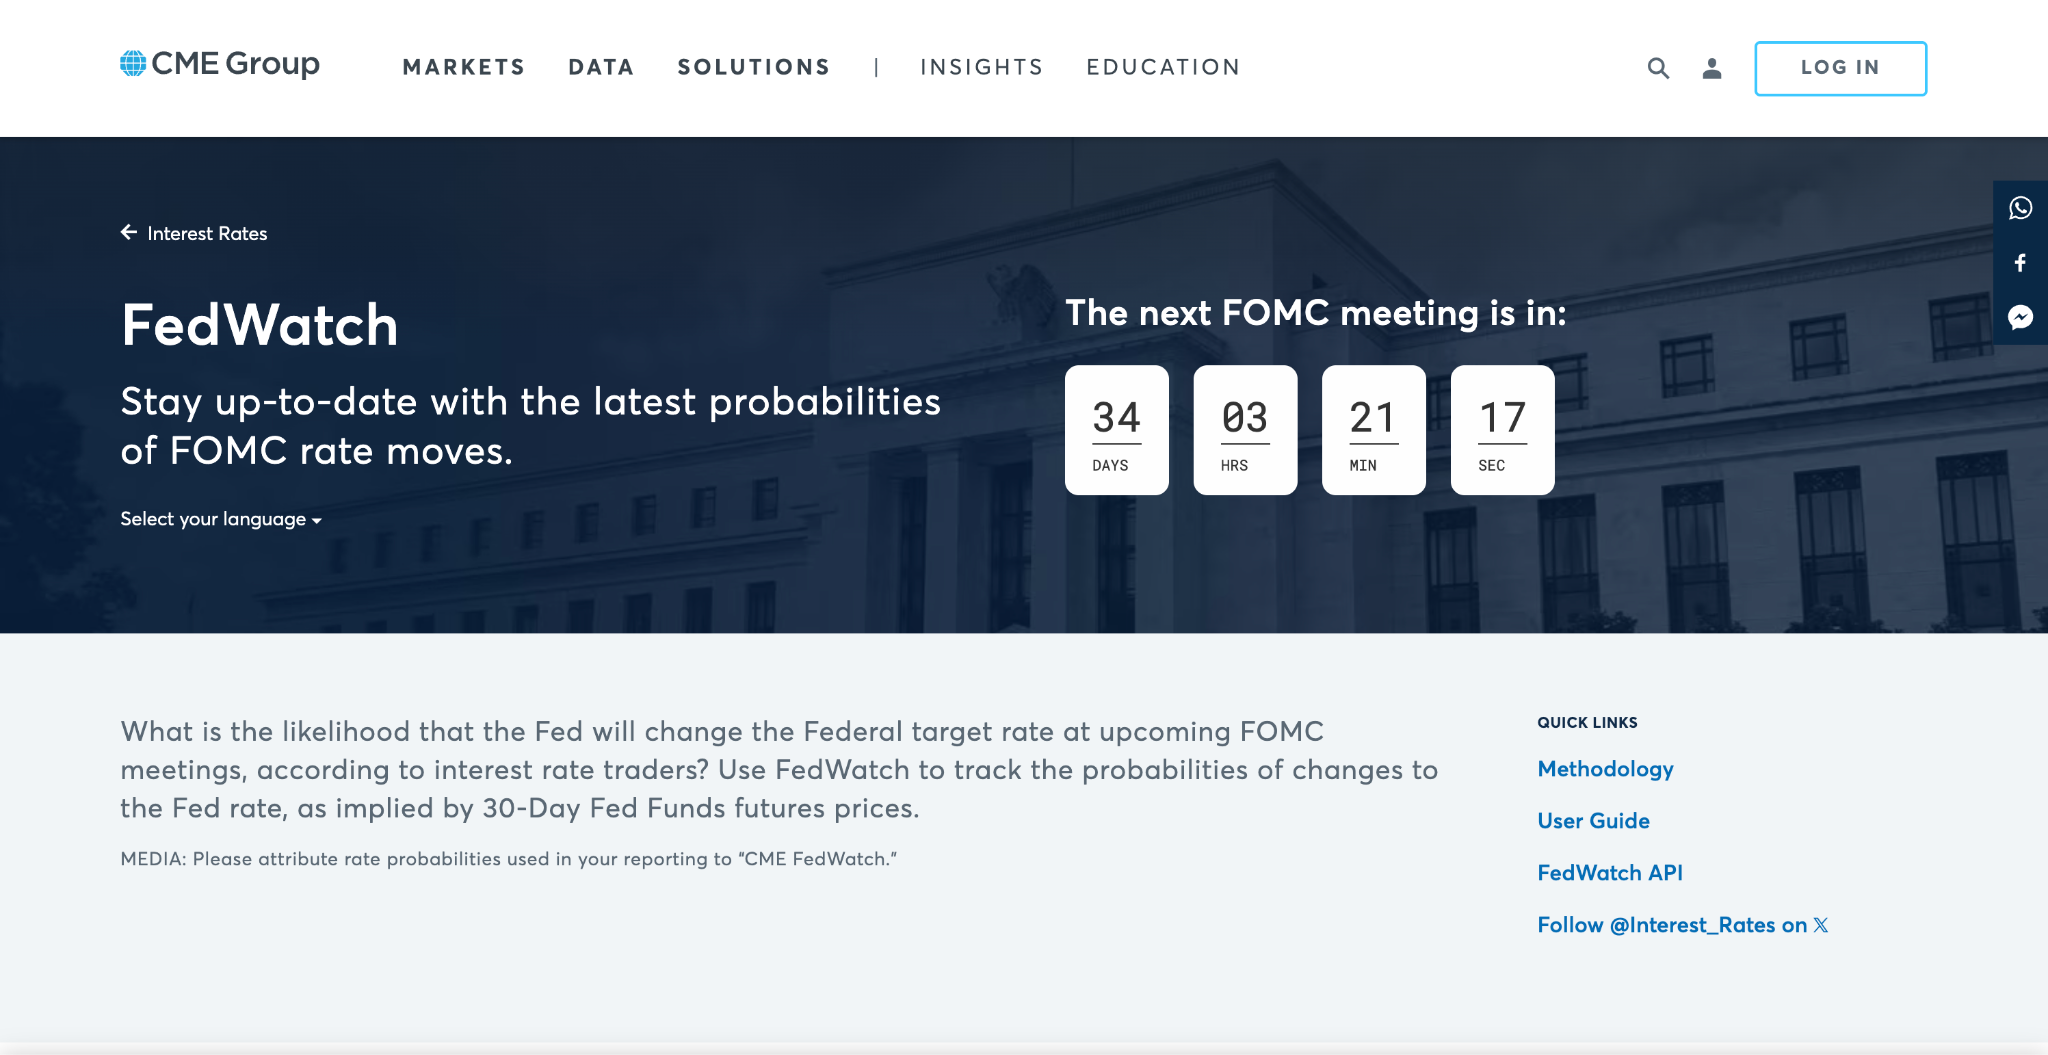
The CME FedWatch Tool is a free, publicly available tool created by CME Group that tracks the market’s expectations for changes to the Federal Funds Target Rate. It does this by analyzing the prices of 30-Day Fed Funds futures contracts, which are financial instruments that reflect what traders collectively believe the Fed will do at upcoming Federal Open Market Committee (FOMC) meetings.
In simpler terms, it’s a real-time probability calculator. It tells you, at any given moment, what percentage of the market expects a rate hike, a rate cut, or no change at the next and future FOMC meetings.
Here’s why this matters: The Federal Reserve’s interest rate decisions are arguably the single most important driver of financial markets. When the Fed raises rates, borrowing becomes more expensive, the dollar tends to strengthen, and risk assets like stocks can come under pressure. When the Fed cuts rates, the opposite tends to happen. Every forex pair with USD, every major stock index, and every commodity priced in dollars is affected.
The tool is available for free at cmegroup.com and is widely referenced by financial media, institutional investors, hedge funds, central banks, retail traders, and even algo traders. If you’ve ever seen a headline along the lines of “Markets are pricing in a 90% chance of a rate cut in June,” that data almost certainly came from the FedWatch Tool.
How Does the FedWatch Tool Work?
Before you can use the FedWatch Tool effectively, it helps to understand what’s going on under the hood.
30-Day Fed Funds Futures
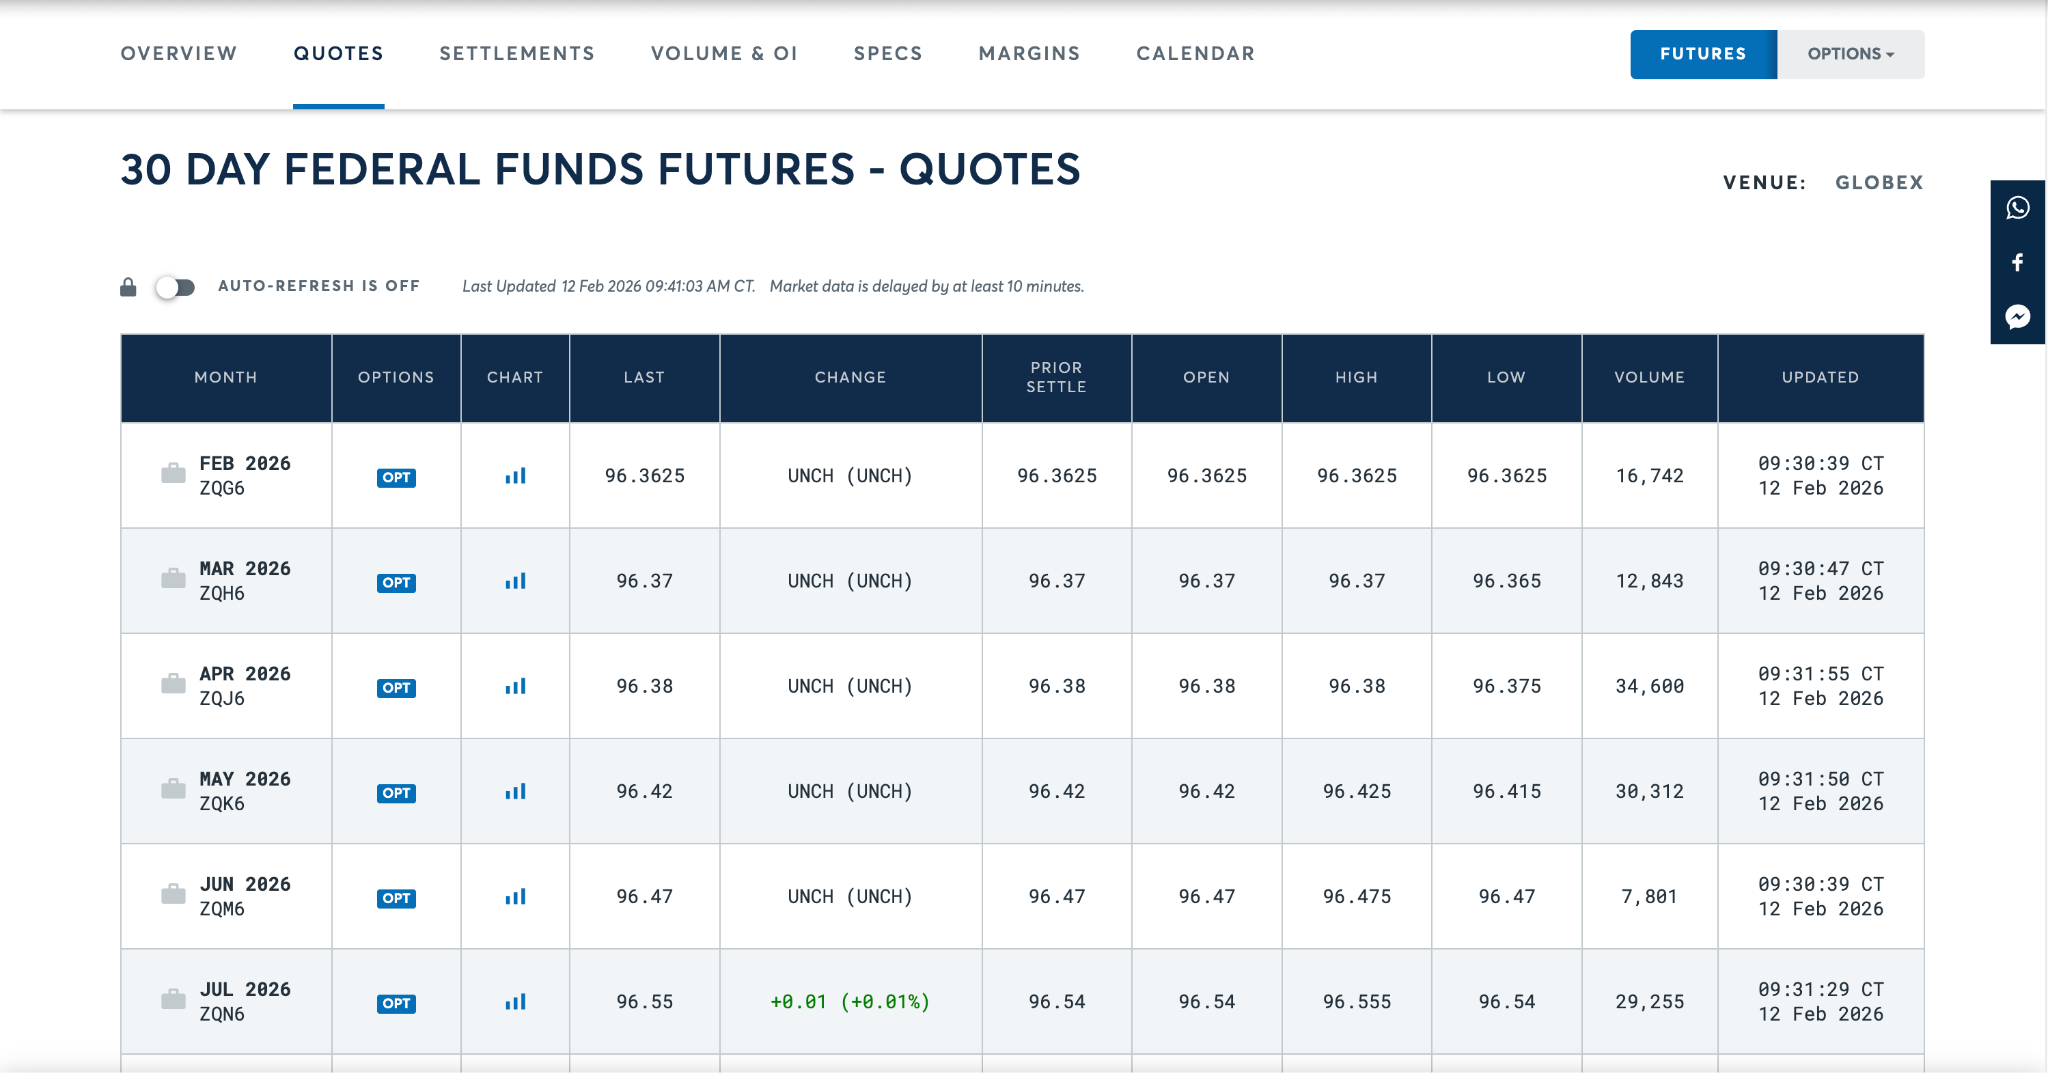
At the core of the FedWatch Tool are 30-Day Fed Funds futures contracts (ticker: ZQ), which are listed monthly on the CME. These contracts are priced based on a simple formula:
Implied Rate = 100 – Futures Price
So, if a Fed Funds futures contract for March is trading at 96.25, the market is implying that the average Effective Federal Funds Rate (EFFR) for March will be 3.75% (100 – 96.25 = 3.75).
These contracts are traded by banks, institutional investors, hedge funds, and professional traders who put real money behind their expectations. That’s what makes this data so powerful – it’s not a survey or a poll. It’s actual capital at risk, reflecting genuine market sentiment.
The Probability Calculation
The FedWatch Tool takes these futures prices and converts them into probabilities for different rate scenarios at each upcoming FOMC meeting. Here’s the general logic:
Let’s walk through a quick example. Say the current target range is 3.50–3.75%, and the Fed Funds futures contract for the next FOMC meeting month implies a rate of 3.60%. That’s closer to the current range than to a 25 bps cut (which would bring it to 3.25–3.50%). In this case, the tool would show a high probability of a hold and a lower probability of a cut.
The FOMC and Meeting Schedule
The FOMC meets eight times per year to set the Federal Funds Target Rate. These are the dates that appear as tabs across the top of the FedWatch Tool. Four of these meetings are accompanied by updated economic projections and the famous “Dot Plot” – a chart showing each FOMC member’s projection for where rates should be at the end of the next several years.
The FedWatch Tool displays probabilities for every scheduled meeting, so you can see not only what the market expects at the next meeting, but also the trajectory of expectations for the rest of the year and beyond.
How to Read the CME FedWatch Tool
Now that you understand the mechanics, let’s talk about how to actually navigate and read the tool. It’s more intuitive than you might think.
Step 1: Select the FOMC Meeting Date
When you open the FedWatch Tool, you’ll see tabs across the top, each corresponding to an upcoming FOMC meeting. The nearest meeting is the default. Click on any meeting to see the probabilities for that specific date.

Step 2: Read the Probability Bars
For each selected meeting, the tool displays a bar chart. Each bar represents a potential target rate range (e.g., 350–375 bps, 325–350 bps, etc.), and the height of the bar shows the probability that the Fed will set rates at that level.
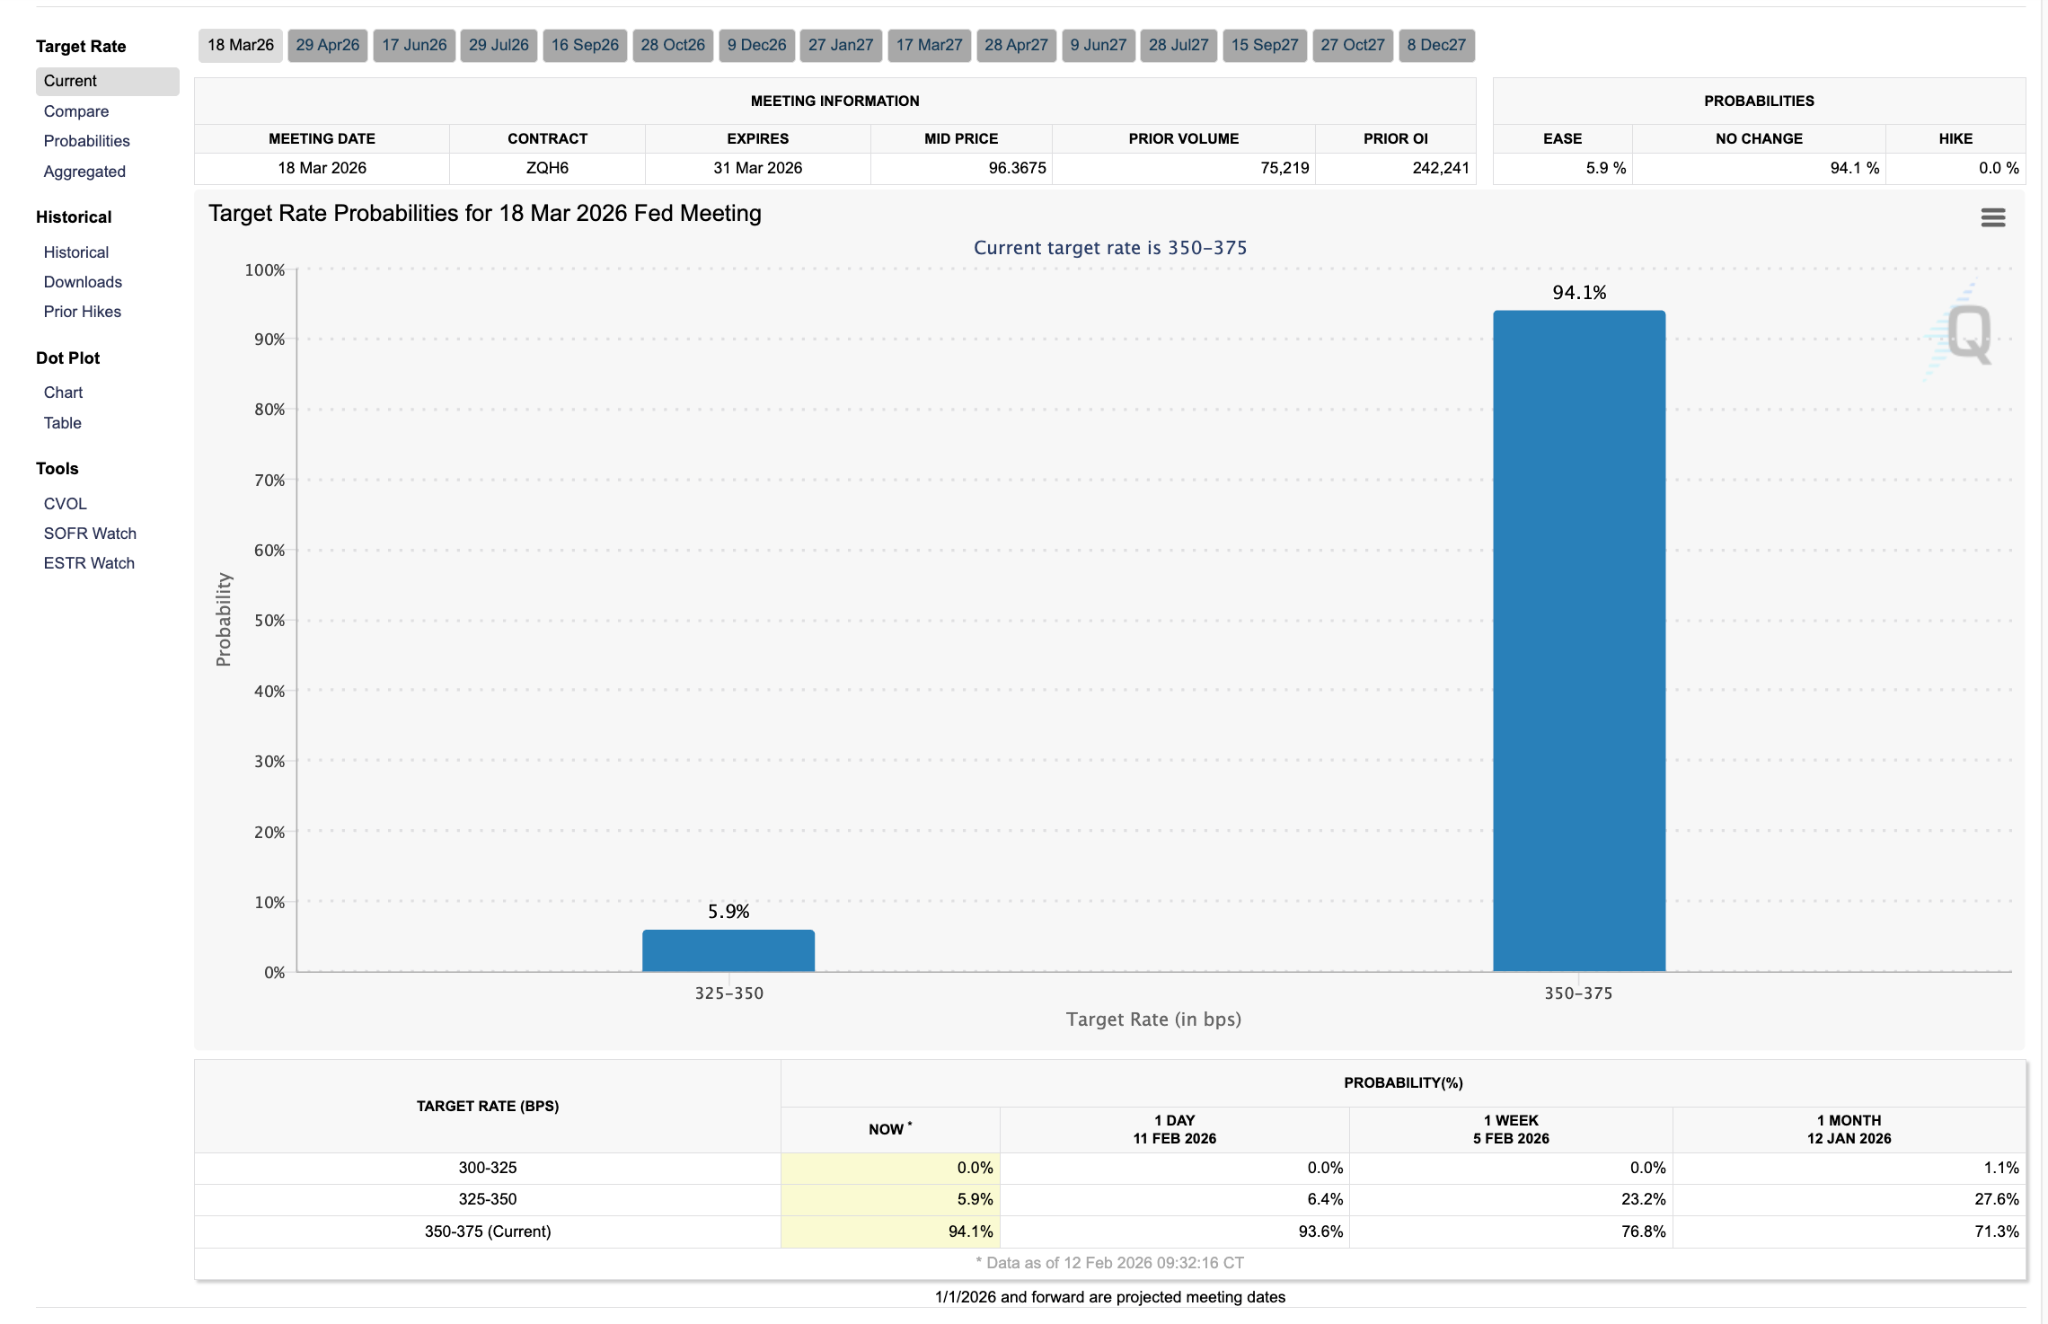
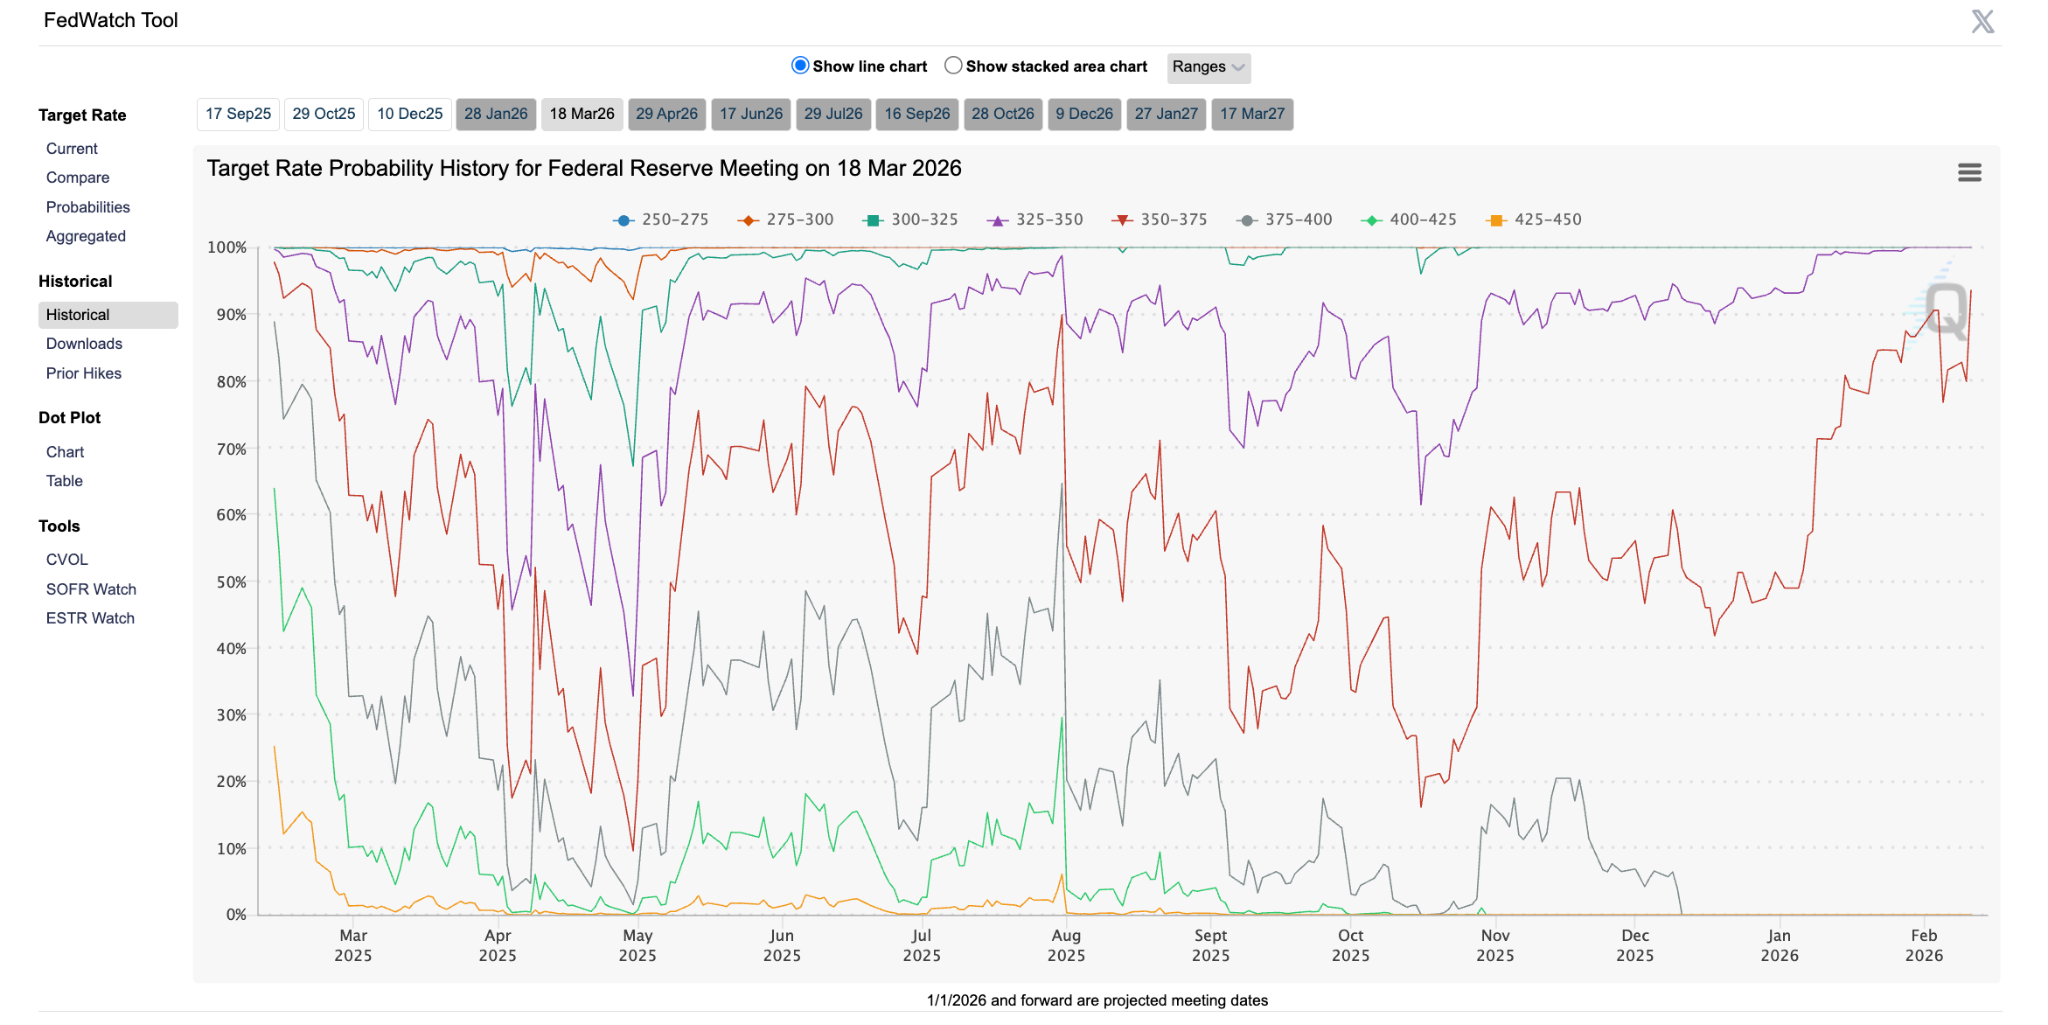
To see this in action, take a look at the FedWatch Tool screenshot above, showing probabilities for the 18 March 2026 FOMC meeting. The current Federal Funds Target Rate is 350–375 bps (3.50%–3.75%), and the chart makes the market's expectation crystal clear: the tall bar on the right shows a 94.1% probability that rates will stay unchanged at 350–375, while the small bar on the left shows just a 5.9% chance of a 25-basis-point cut to 325–350. z
There's a 0% probability of a hike. In other words, the market is overwhelmingly "pricing in" a hold at this meeting.
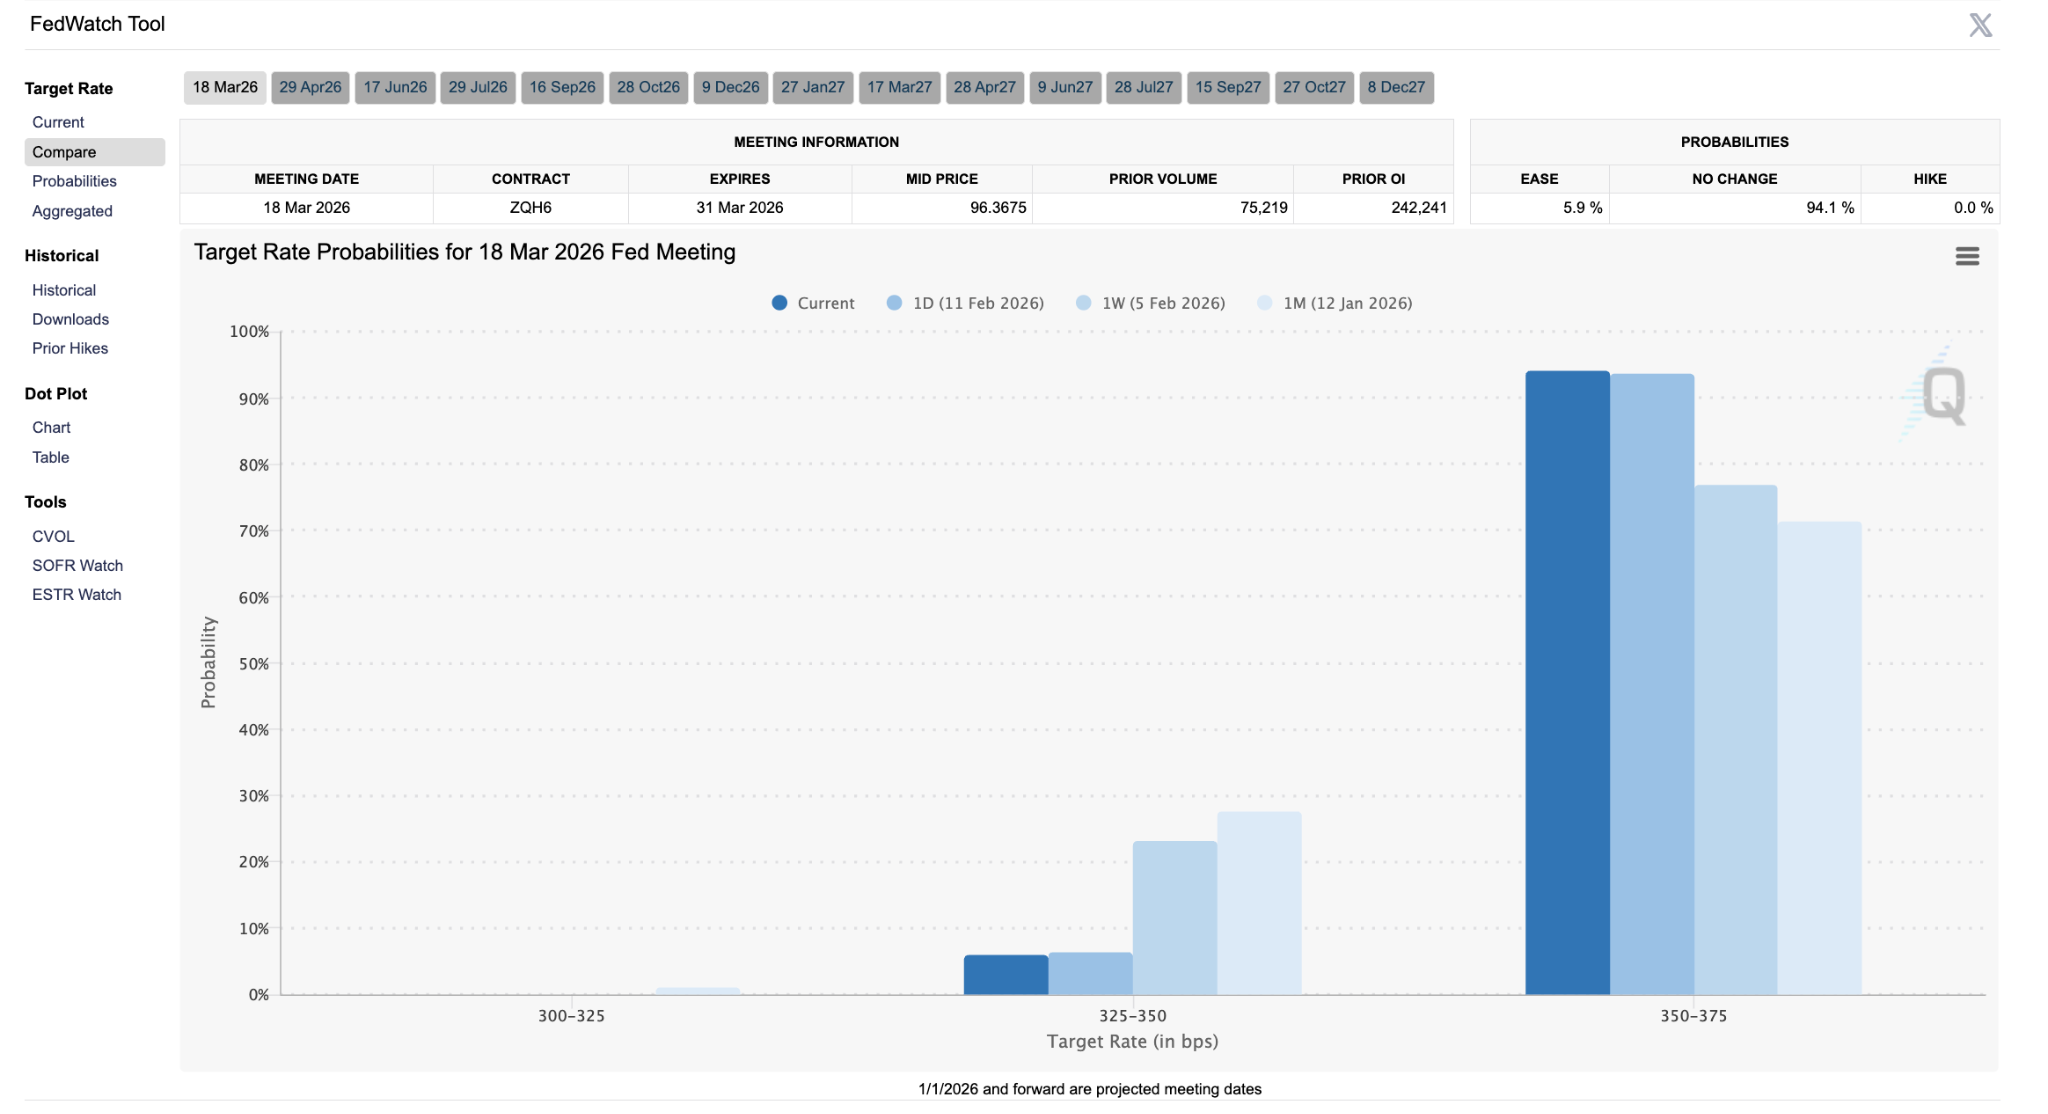
Step 3: Use the Compare and Historical Tabs
This is where it gets really interesting for traders. The “Compare” tab lets you see how probabilities have changed compared to one day ago, one week ago, and one month ago. This is incredibly useful for spotting shifts in market sentiment. For instance, if the probability of a rate cut jumped from 30% to 70% in a single week, something major happened – and you should know what it was.
The “Historical” tab shows how probabilities evolved over time for a specific meeting date. You can track up to one year of historical data and even download it in Excel format for deeper analysis.
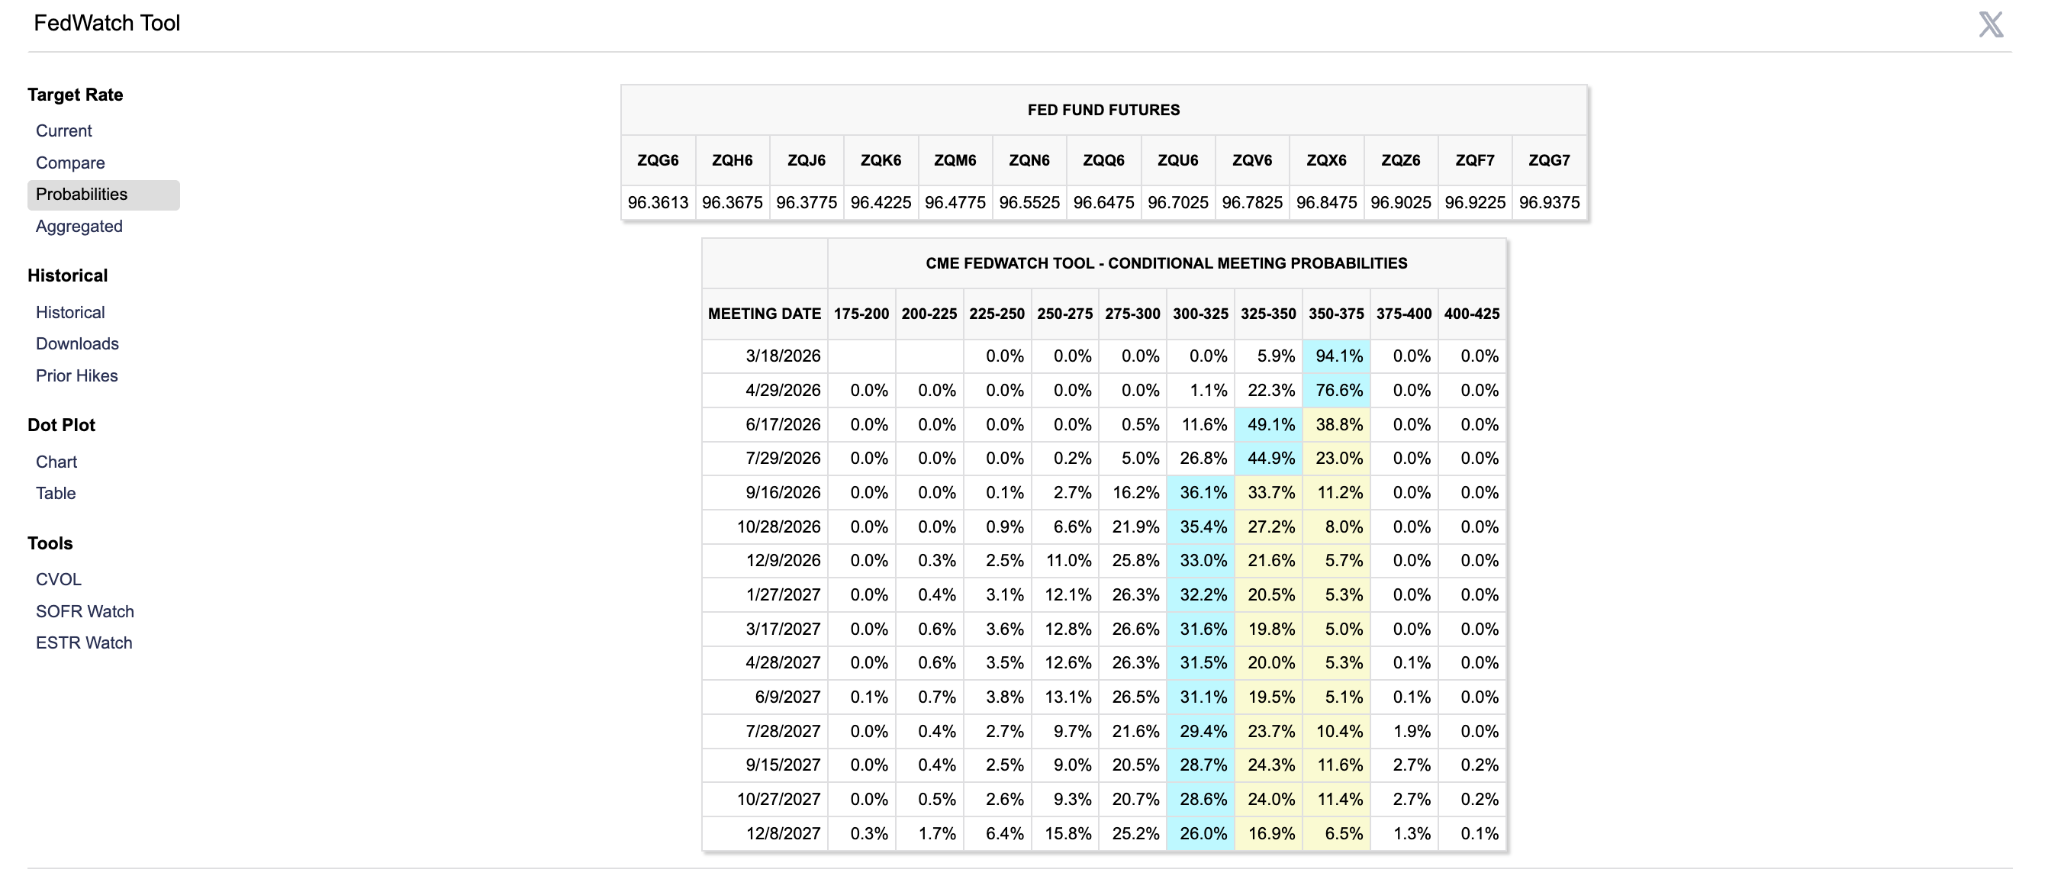
Step 4: Check the Probabilities View
The “Probabilities” tab gives you a comprehensive overview of all meetings and all potential outcomes in a single matrix. This is the go-to view for traders who want to see the full picture – from the next meeting through the end of the year. It also includes the corresponding Fed Funds futures prices for reference.
Step 5: Explore the Dot Plot
The tool also includes the Fed’s Dot Plot, which is updated quarterly. Each dot represents an individual FOMC member’s projection for where the Fed Funds rate should be at the end of the current and upcoming years. The blue dots represent the median projection, while the red dot shows the rate implied by year-end Fed Funds futures. Comparing the two tells you whether the market is more hawkish or dovish than the Fed itself.

Quick Reference for Reading the FedWatch Tool
Here's a quick table to help you read the CME FedWatch tool:
How to Use the CME FedWatch Tool to Gauge Market Sentiment
Now we get to the good stuff. Knowing how to read the tool is one thing. Knowing how to use it to inform your trading decisions is where it really pays off.
1. Anticipate Moves Across Asset Classes
The Fed’s rate decisions ripple through every corner of the financial markets. Here’s how different asset classes typically respond:
- Forex: A higher probability of rate hikes tends to strengthen the USD, while rate cut expectations weaken it. If you’re trading forex pairs like EUR/USD, GBP/USD, or any USD pair, the FedWatch Tool is essential for understanding directional bias.
- Indices: Stock indices like the S&P 500 and Nasdaq tend to rally on expectations of rate cuts (cheaper borrowing, more liquidity) and pull back when hike expectations rise.
- Commodities: Gold, in particular, is highly sensitive to rate expectations. Lower rates reduce the opportunity cost of holding gold (which pays no yield), making it more attractive.
- Bonds: Treasury yields move inversely to bond prices and are directly influenced by Fed rate expectations. The FedWatch Tool helps you position ahead of yield moves.
2. Trade the Expectation, Not Just the Decision
Here’s a key principle that seasoned traders know well: markets don’t move on what the Fed does – they move on whether the Fed does something different from what was expected. This is the concept of “pricing in.”
If the FedWatch Tool shows a 95% probability of a hold and the Fed holds rates, the market reaction will likely be muted. But if there’s an unexpected cut – even a small one – you can expect significant volatility across all asset classes. The same applies in reverse: a surprise hike when none was expected can send shockwaves through the markets.
3. Monitor Shifts in Probability After Key Data Releases
Economic data releases are the primary catalysts that cause FedWatch probabilities to shift. Keep these on your radar:
- CPI (Consumer Price Index): Hotter-than-expected inflation typically pushes rate cut probabilities down and hike probabilities up.
- Non-Farm Payrolls (NFP): Strong jobs data give the Fed less reason to cut, shifting probabilities accordingly.
- PCE (Personal Consumption Expenditures): The Fed’s preferred inflation gauge. Surprises here move the needle quickly.
- Fed speeches and minutes: Hawkish or dovish language from Fed officials can cause immediate probability shifts, even without new data.
- GDP and employment data: Indicators of economic strength or weakness directly influence rate expectations.
For example, on April 10, 2024, when the Bureau of Labor Statistics released a hotter-than-expected CPI report, Fed Funds futures trading more than tripled in a single day as the market frantically repriced its rate expectations. That’s the kind of volatility that traders live for.
Learn How to Read and Trade the Economic Calendar
4. Compare Market Expectations with the Fed’s Dot Plot
One of the most powerful features of the FedWatch Tool is its Dot Plot overlay. The Dot Plot shows where individual FOMC members think rates should be, while the red dot shows where the futures market thinks rates will be.
When there’s a disconnect between the two, it creates a potential trading setup. For instance, if the market is pricing in aggressive cuts but the Dot Plot suggests the Fed will hold steady, one side will be wrong, and the correction can move markets significantly.
5. Build the FedWatch Into Your Pre-Trade Routine
Make it a habit. Before you execute any trade in a USD-related instrument, check the FedWatch Tool. Ask yourself:
- What does the market expect at the next meeting?
- Have probabilities shifted recently? If so, why?
- Is there an upcoming data release that could cause a major shift?
- Am I trading with the consensus or against it?
This five-minute check can save you from being blindsided by a sudden shift in market sentiment.
Why the FedWatch Tool Is Such a Valuable Tool for Traders
Let’s be clear: you don’t need to be a fixed-income specialist or a macro economist to benefit from the FedWatch Tool. Whether you’re a forex scalper, a swing trader on indices, or a long-term commodity investor, here’s why this tool deserves a permanent spot in your trading toolkit.
It’s Based on Real Money, Not Opinions
Unlike surveys, analyst predictions, or social media sentiment, the FedWatch Tool is derived from actual futures prices. These are contracts backed by real capital, traded by institutional investors, banks, and sophisticated market participants. When someone trades a Fed Funds futures contract, they’re putting their money where their mouth is. That makes this data significantly more reliable than a poll of talking heads on financial television.
It Has Strong Predictive Accuracy
Research published in the Journal of Futures Markets in late 2025 found that the FedWatch model predicts FOMC rate decisions with approximately 88% accuracy 30 days prior to meetings. That’s notably higher than the roughly 75% accuracy of raw Fed Funds futures prices alone. The study also found that FedWatch’s popularity has contributed to reducing market uncertainty ahead of FOMC meetings.
It’s Free and Accessible
You don’t need a Bloomberg Terminal or a premium data subscription. The FedWatch Tool is completely free on CME Group’s website. You can access it from any device, download historical data, and even compare current probabilities with past ones. For retail traders, this is a game-changer as you’re looking at the same data that institutional traders use to make million-dollar decisions.
It Helps You Manage Risk
Knowing what the market expects allows you to manage risk more effectively. If there’s a 50/50 split between a hold and a cut, you know that the FOMC meeting is likely to generate significant volatility. You might choose to reduce your position size, widen your stop-losses, or simply sit on the sidelines until the dust settles. On the other hand, if probabilities are heavily skewed (say, 97% chance of a hold), you can trade with more confidence, knowing that a surprise is unlikely.
It Keeps You Ahead of the Curve
By monitoring the FedWatch Tool regularly, you’re not just reacting to news – you’re anticipating it. You can see market expectations evolving in real time, position yourself accordingly, and avoid being on the wrong side of a major sentiment shift.
Limitations of the FedWatch Tool
No tool is perfect, and the FedWatch Tool is no exception. It’s important to understand its limitations so you can use it wisely.
- It reflects expectations, not certainty. The market has been wrong before. In March 2023, for example, futures markets were pricing in a Fed Funds rate of around 4% by year-end. The actual rate finished 2023 at 5.25–5.50%. The further out you look, the less reliable the probabilities become.
- It doesn’t capture tone or context. The Fed can hold rates steady and still move markets by signaling future intentions through its statement, press conference, or Dot Plot. The FedWatch Tool shows rate probabilities, but it can’t measure the hawkish or dovish tone of the Fed’s communication.
- Probabilities can shift rapidly. A single economic data release or geopolitical event can cause probabilities to swing dramatically in hours. Treat the data as a snapshot in time, not a permanent forecast.
- It’s US-focused.The FedWatch Tool tracks only the US Federal Reserve. If you’re trading assets influenced by other central banks (ECB, BOJ, BOE, RBA), you’ll need additional tools for those.
Wrapping Up
The CME FedWatch Tool is one of those rare resources that’s both incredibly powerful and completely free. Whether you’re a beginner trying to understand why the markets moved today, or an experienced trader positioning ahead of the next FOMC meeting, this tool gives you a direct window into the collective intelligence of the futures market.
Make it a habit to check the FedWatch Tool regularly, especially before major economic data releases and FOMC meetings. Pay attention to how probabilities shift over time – those shifts often signal trading opportunities before they show up on the price chart.
At Switch Markets, we’re committed to empowering traders of all levels with the tools, education, and trading conditions they need to succeed. If you’re ready to put your market knowledge into action, you can start by opening a demo account or exploring our suite of free trading tools to sharpen your edge. Happy trading.
FAQs
Before you go and bookmark the FedWatch Tool (which you should), let's clear up some of the most frequently asked questions traders have about how it works and how to get the most out of it.
Where can I access the CME FedWatch Tool?
You can access it for free at cmegroup.com/markets/interest-rates/cme-fedwatch-tool.html. No account or subscription is required.
How often is the FedWatch Tool updated?
The tool updates in real time during trading hours, as it’s based on live Fed Funds futures prices. Probabilities change continuously as new market data flows in.
Can I use the FedWatch Tool for forex trading?
Absolutely. The US dollar’s direction is heavily influenced by Fed rate expectations. If you trade any USD pair, the FedWatch Tool should be part of your analysis. Rate cut expectations tend to weaken the dollar, while rate hike expectations tend to strengthen it.
What does “pricing in” mean?
When traders say a rate move is “priced in,” it means the futures market has already adjusted to reflect that expectation. If a rate cut is fully priced in and the Fed delivers it, the market reaction will be minimal. The big moves happen when reality deviates from expectations.
What is the current Federal Funds Rate?
As of the most recent FOMC meeting in January 2026, the Federal Funds Target Rate stands at 3.50–3.75%. The Fed held rates steady at this meeting, as was widely expected. Market expectations currently point to potential further rate cuts in the second half of 2026, with June being the earliest likely date.
Risk Disclosure: The information provided in this article is not intended to give financial advice, recommend investments, guarantee profits, or shield you from losses. Our content is only for informational purposes and to help you understand the risks and complexity of these markets by providing objective analysis. Before trading, carefully consider your experience, financial goals, and risk tolerance. Trading involves significant potential for financial loss and isn't suitable for everyone.