What Are Pivot Points In Trading and How to Use Them?
If you’ve ever stared at a chart wondering where on earth price might pause, bounce, or break out, you’re not alone. This is the reason why so many traders use Pivot Points, which are key price levels used to identify potential areas of support and resistance.
Pivot points are simple price numbers derived from previous sessions (day, week, or month) price data that help us anticipate where today’s price might turn. They offer structure when markets feel chaotic.
In this article, we’ll walk through what pivot points are, how to calculate them, how to use them, and why traders count on them.
What Are Pivot Points in Trading?
Pivot points are predefined support and resistance levels derived from the previous trading period’s high, low, and closing prices. Chartists use them to identify where the price may reverse or pause.
Practically, pivot points use the prior period’s high, low, and close to estimate future support and resistance levels, making them a predictive or leading indicator rather than a lagging one.
Floor traders developed them decades ago to set key price levels for the day, and modern traders still rely on them for day‑trading, swing‑trading, and even longer‑term analysis.
Why They Matter
Pivot points matter because they provide objective support and resistance levels. Unlike hand‑drawn trend lines, pivot points are mathematically defined and consistent.
A move above the pivot point suggests bullish sentiment; staying below it suggests a bearish bias. When prices approach R1 or S1, traders expect a reaction. If price breaks through R1 with momentum, it may run to R2. If it fails at S1, it might bounce back toward PP. Pretty simple.
Timeframe matters too. For intraday charts like 1‑, 5‑, or 15-minute, pivot points are calculated from the previous day’s high, low, and close and remain fixed throughout the current day. Weekly pivot points use last week’s data, and monthly pivot points use last month’s. That means swing traders can use weekly or monthly pivot levels to gauge the next week or month’s important zones.
How to Calculate Pivot Points
Calculating pivot points manually is straightforward. Here’s a step‑by‑step process:
1. Gather data: At the end of your trading period (hour, day, week, or month), note the high (H), low (L), and close (C) prices from that period.
2. Compute the pivot point (PP): Add H, L, and C together and divide by 3: (H + L + C) / 3. This value acts as the equilibrium point between supply and demand.
3. Calculate support and resistance levels:
- R1 = (2 × PP) − L
- S1 = (2 × PP) − H
- R2 = PP + (H − L)
- S2 = PP − (H − L)
4. Plot them on your chart: Draw horizontal lines at PP, R1, S1, R2, and S2. These become your potential pivot point price levels and support and resistance levels.
Most trading platforms and calculators perform these steps automatically, but doing it by hand once or twice helps you understand what those lines mean. If you wish to add the Pivot Point indicator to MT4/MT5, you must first search for the indicator on MQL5 and then add it to your platform.
Note that you can also use our Pivot Point calculator on Switch Markets. Our own pivot‑point chart below illustrates how these levels overlay on price action. Notice how the price oscillates between support and resistance, sometimes pausing or reversing at those levels.
How to Use Our Pivot Point Calculator
There are plenty of free tools online for those who don’t want to crunch numbers manually. One easy‑to‑use resource is the pivot point calculator on Switch Markets.
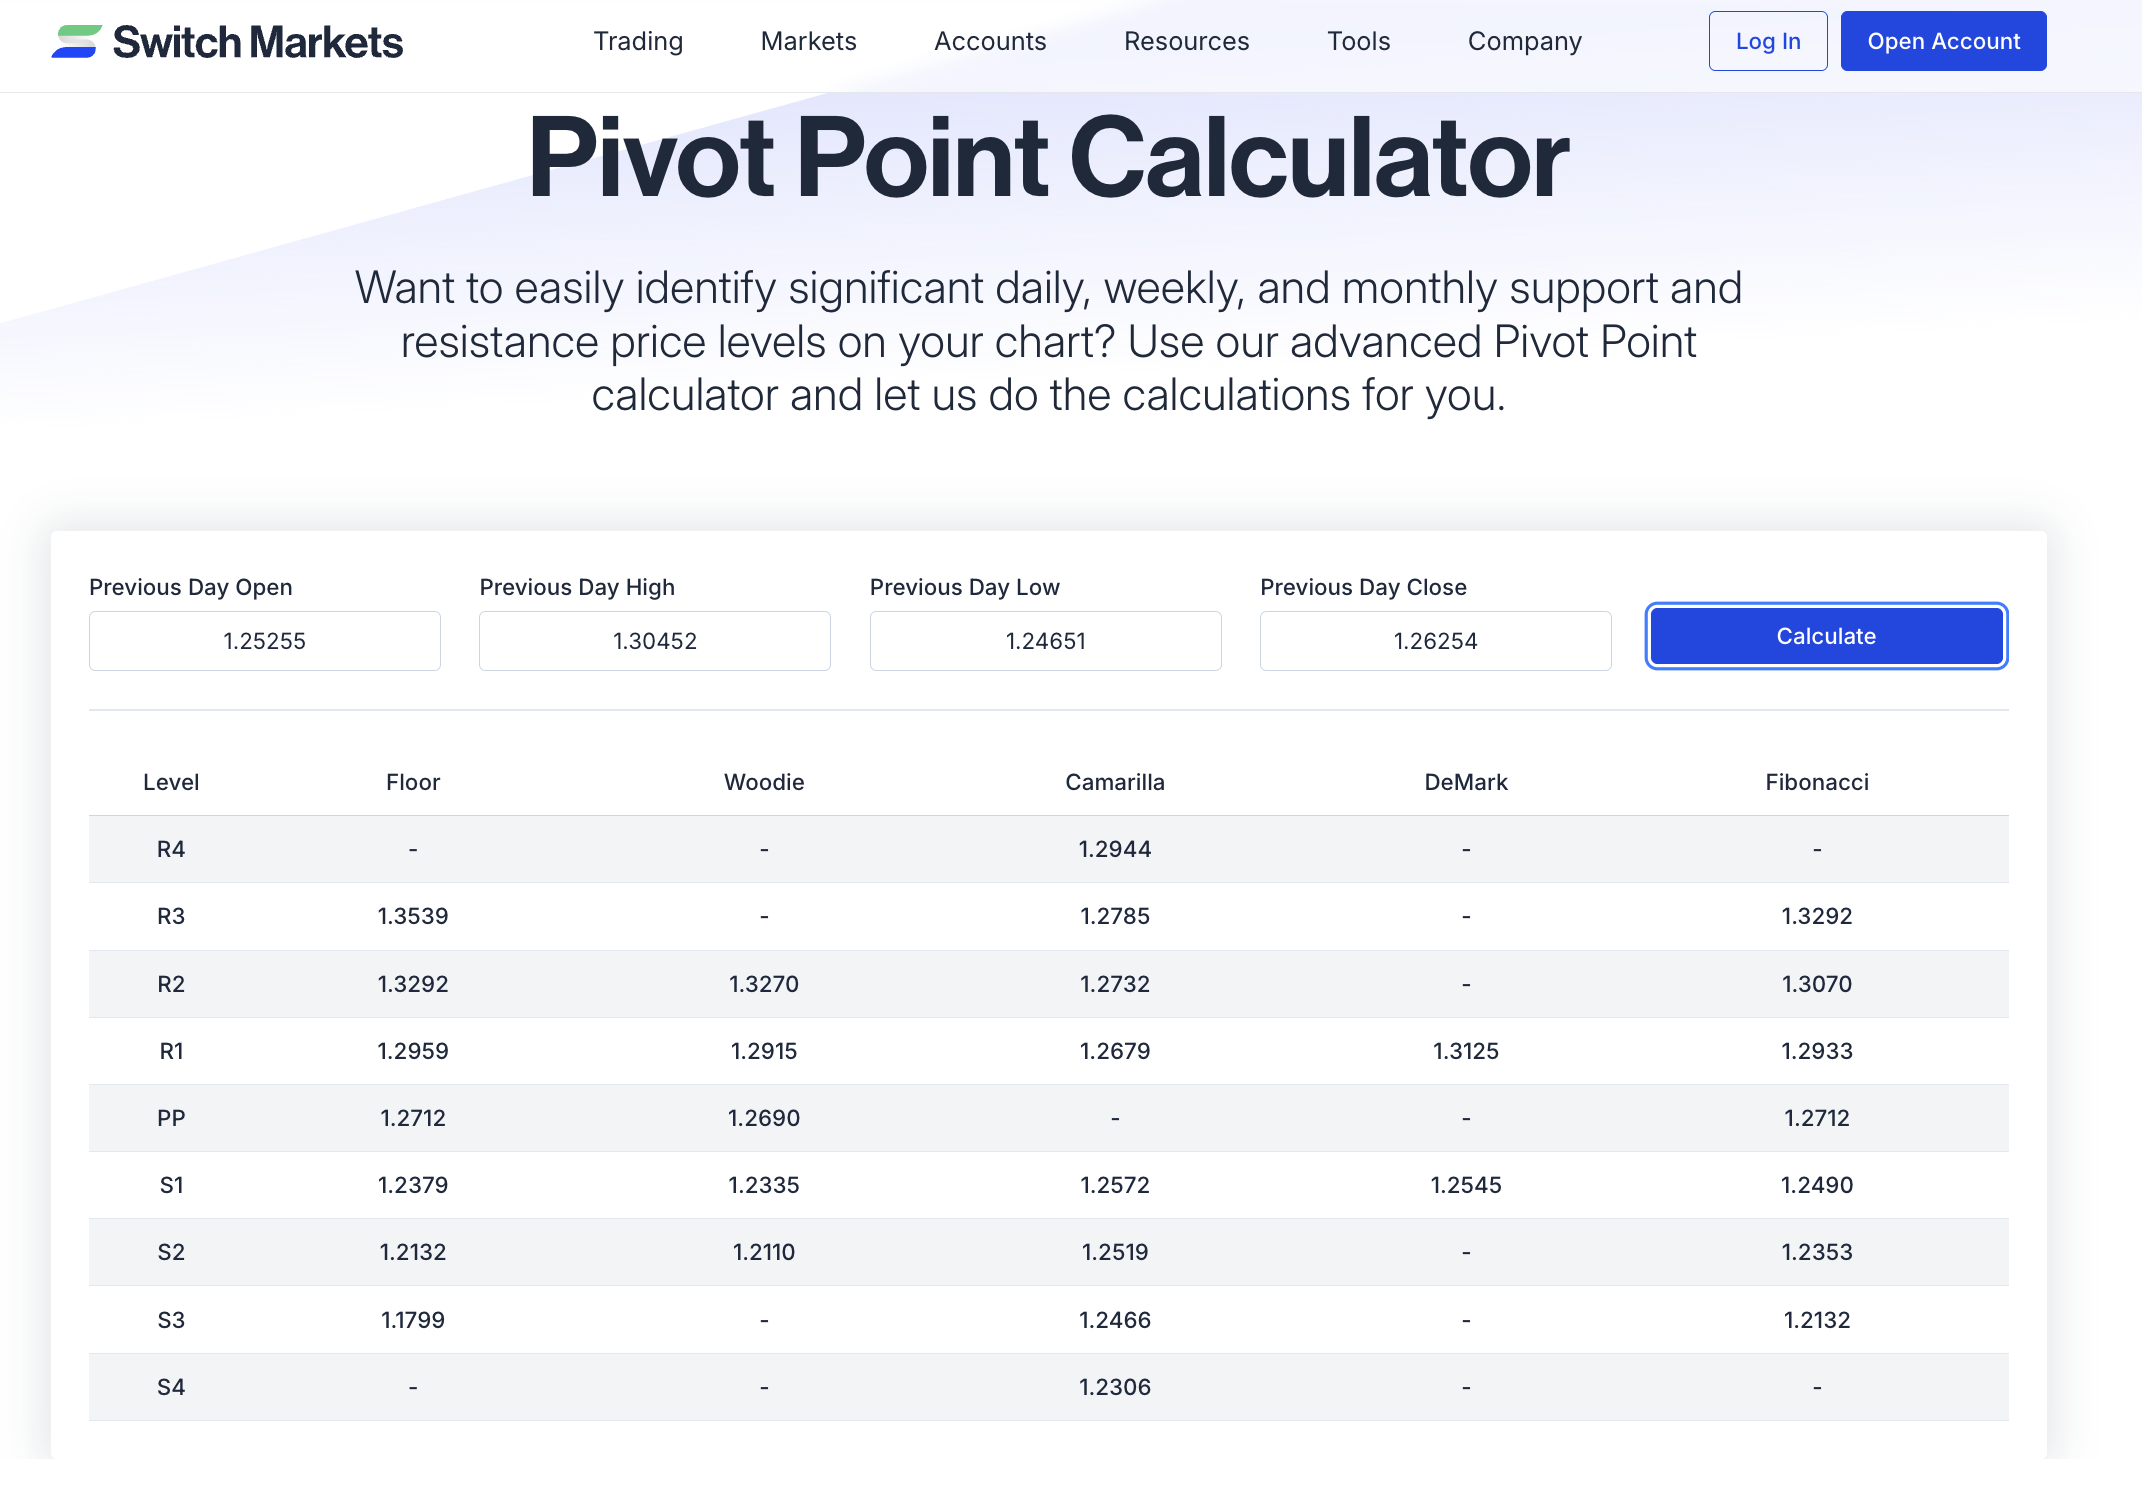
This calculator lets you input your previous day's open, high, low, and closing prices (although it can be any timeframe). After you hit calculate, the tool spits out the pivot point and several support and resistance levels for the method you want to use (Standard/Floor, Woodie, Camarilla, Demark, Fibonacci pivot points).
Here’s what the result should look like:
Let’s transfer these values to our chart, and let’s see what it looks like. For this example, we will use the Woodie pivot points. Here’s the result:

As you can see, now you have key support and resistance levels on a price chart that can help you identify areas where the price might bounce, pause, or break above/below.
Here’s a simple way to make the most of such a calculator:
Pivot Point Strategies – How to Use Pivot Points in Trading
Knowing the numbers is just the start. The real art is using pivot points to make trading decisions.
Below are several practical pivot point trading strategies used by day traders and swing traders alike:
1. Bounce off Support and Resistance
A simple way to understand this strategy is to think of it as a price reacting when it hits a wall. Those walls are support or resistance zones. Now, when one of those zones happens to line up perfectly with a pivot point level (like R1, R2, S1, or S2), the reaction often looks stronger.
Let’s take a look at the USDCHF example below:
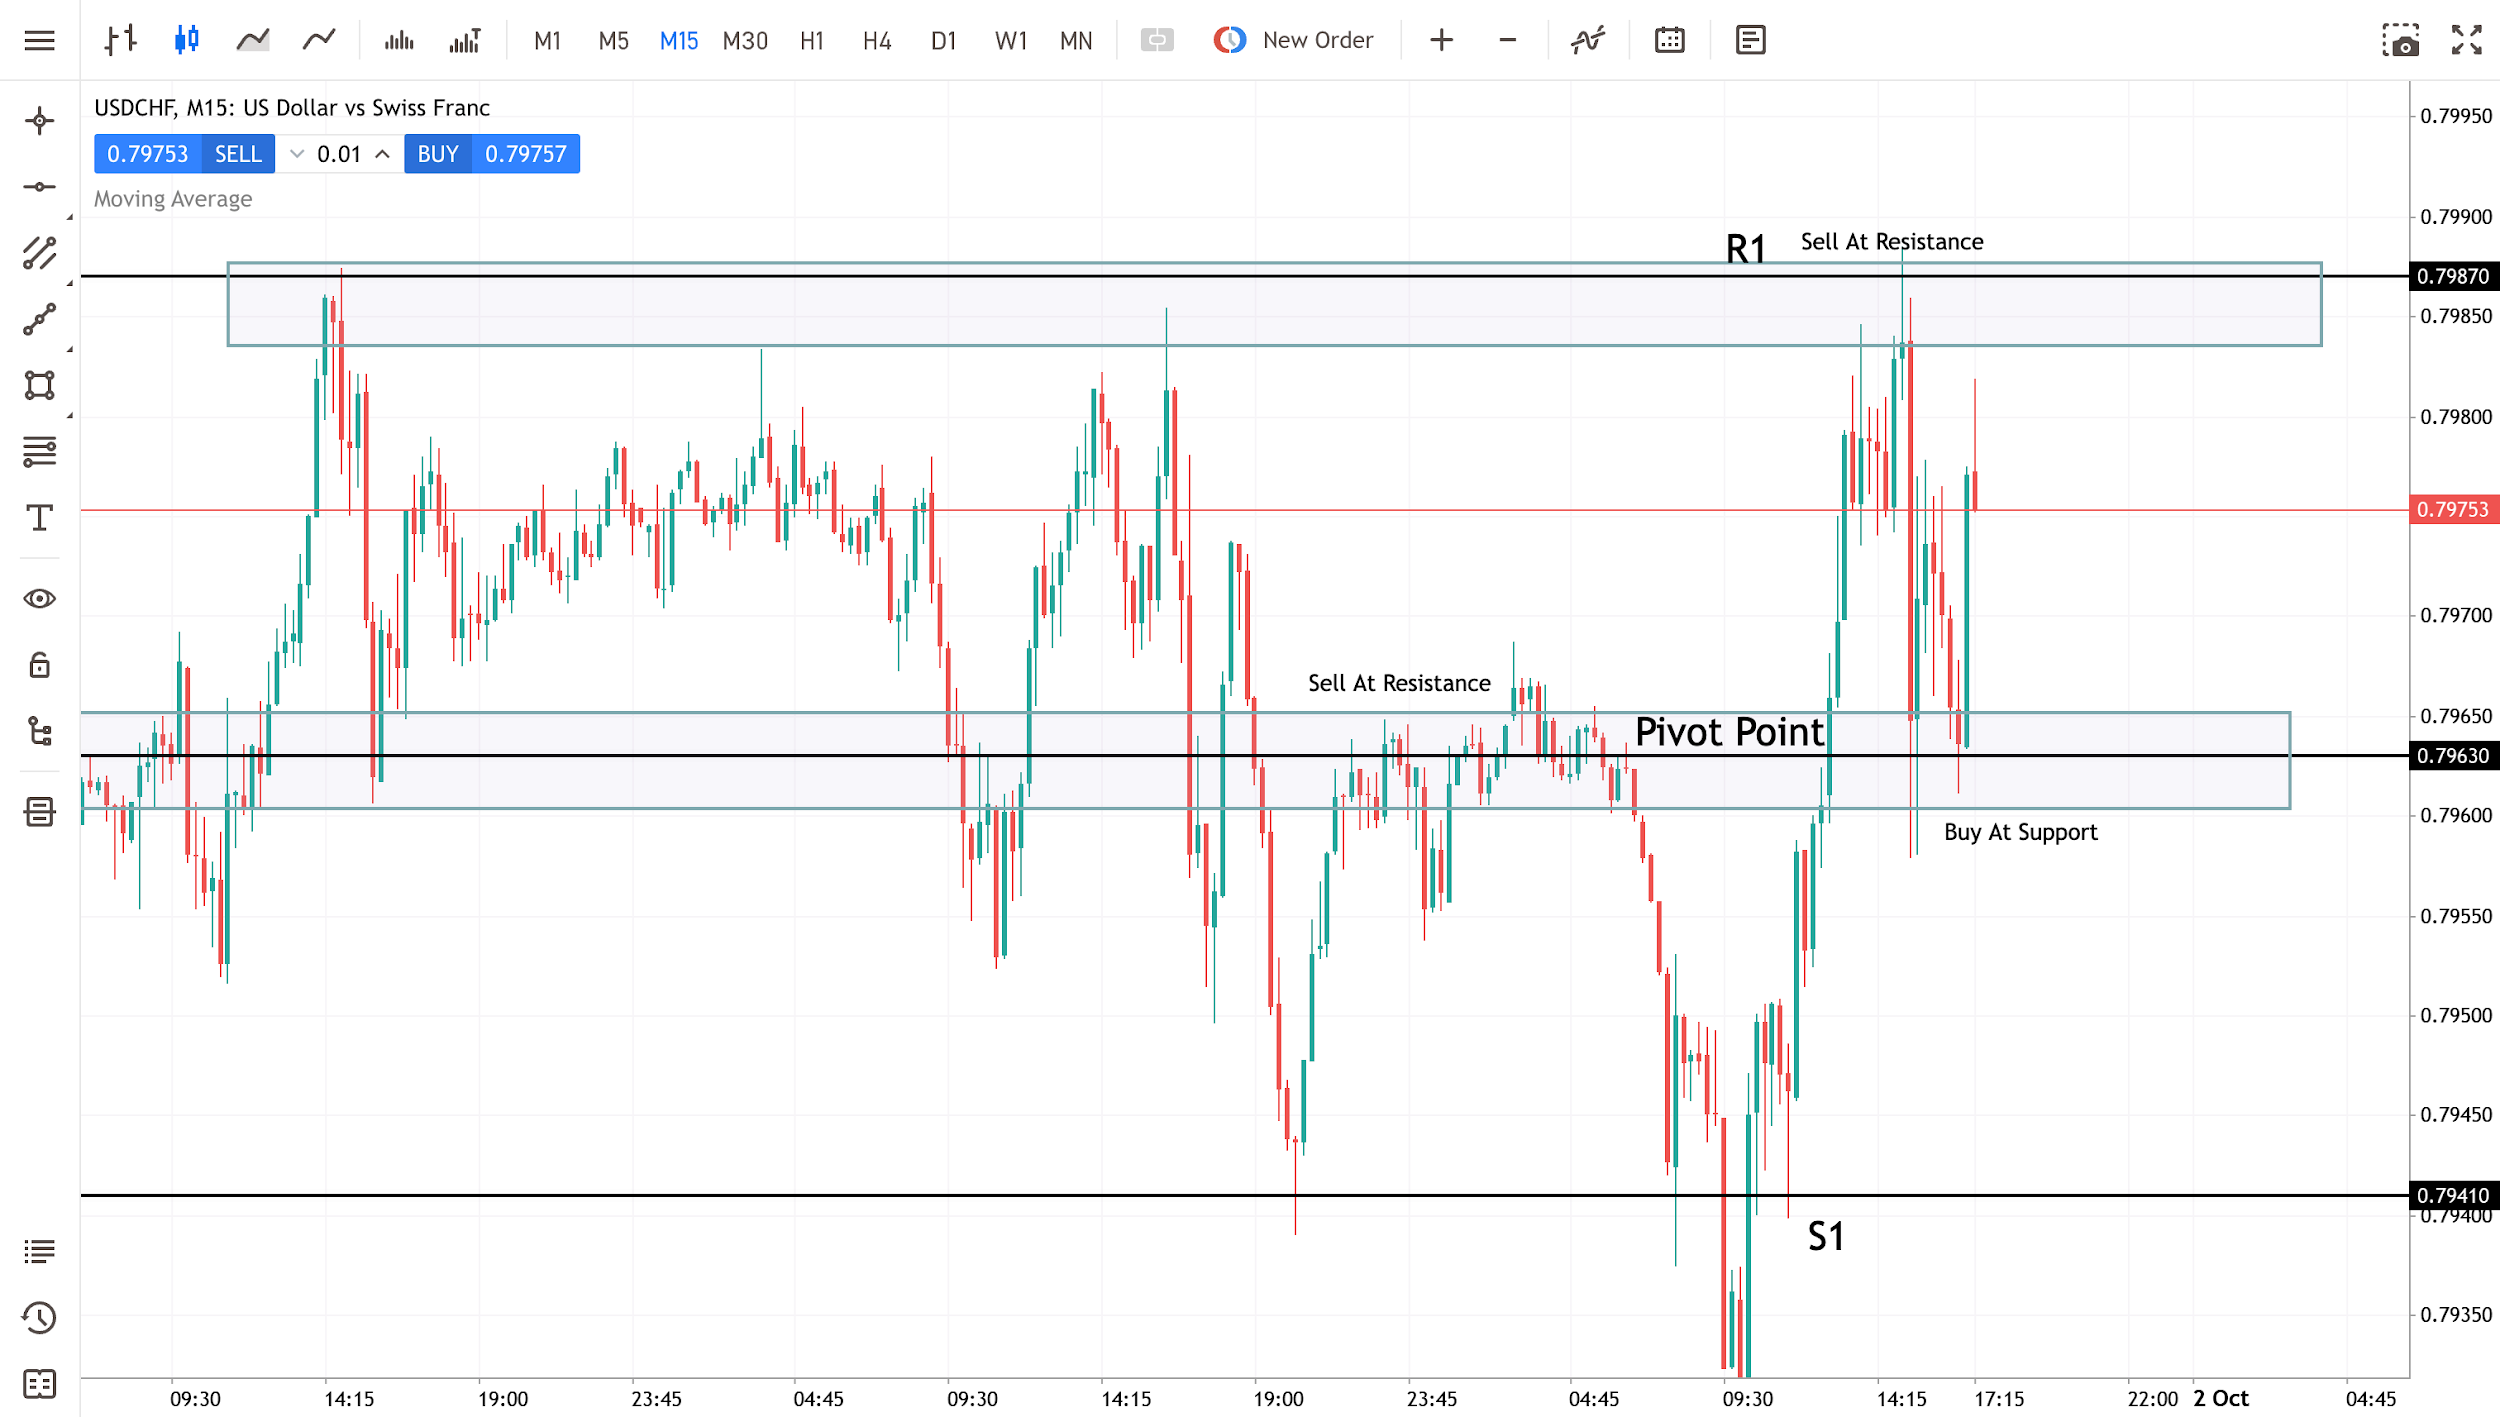
As you can see, the price spent a lot of time moving around the central pivot. It first acted as a resistance zone. Price tried to go above it but kept getting rejected. Later, the same level became a support zone where buyers briefly stepped in.
When the price rallied upward, it reached the R1 pivot level. The interesting part is that it wasn’t just R1. A resistance zone was already forming there, marked by the shaded box. When the horizontal resistance and R1 overlapped, sellers had a strong reason to defend that area. Price stalled and reversed almost immediately.
This is why traders like combining zones with pivots. On their own, each might suggest a “maybe.” Together, they improve the odds. When price reacts at those levels, it’s usually not by chance. The market respects areas that many people are watching at the same time.
2. Combine Pivot Points with Chart Patterns
Chart patterns (flags, triangles, head‑and‑shoulders, etc.) often coincide with pivot levels. When a pattern breakout lines up with a pivot level, the setup becomes more compelling.
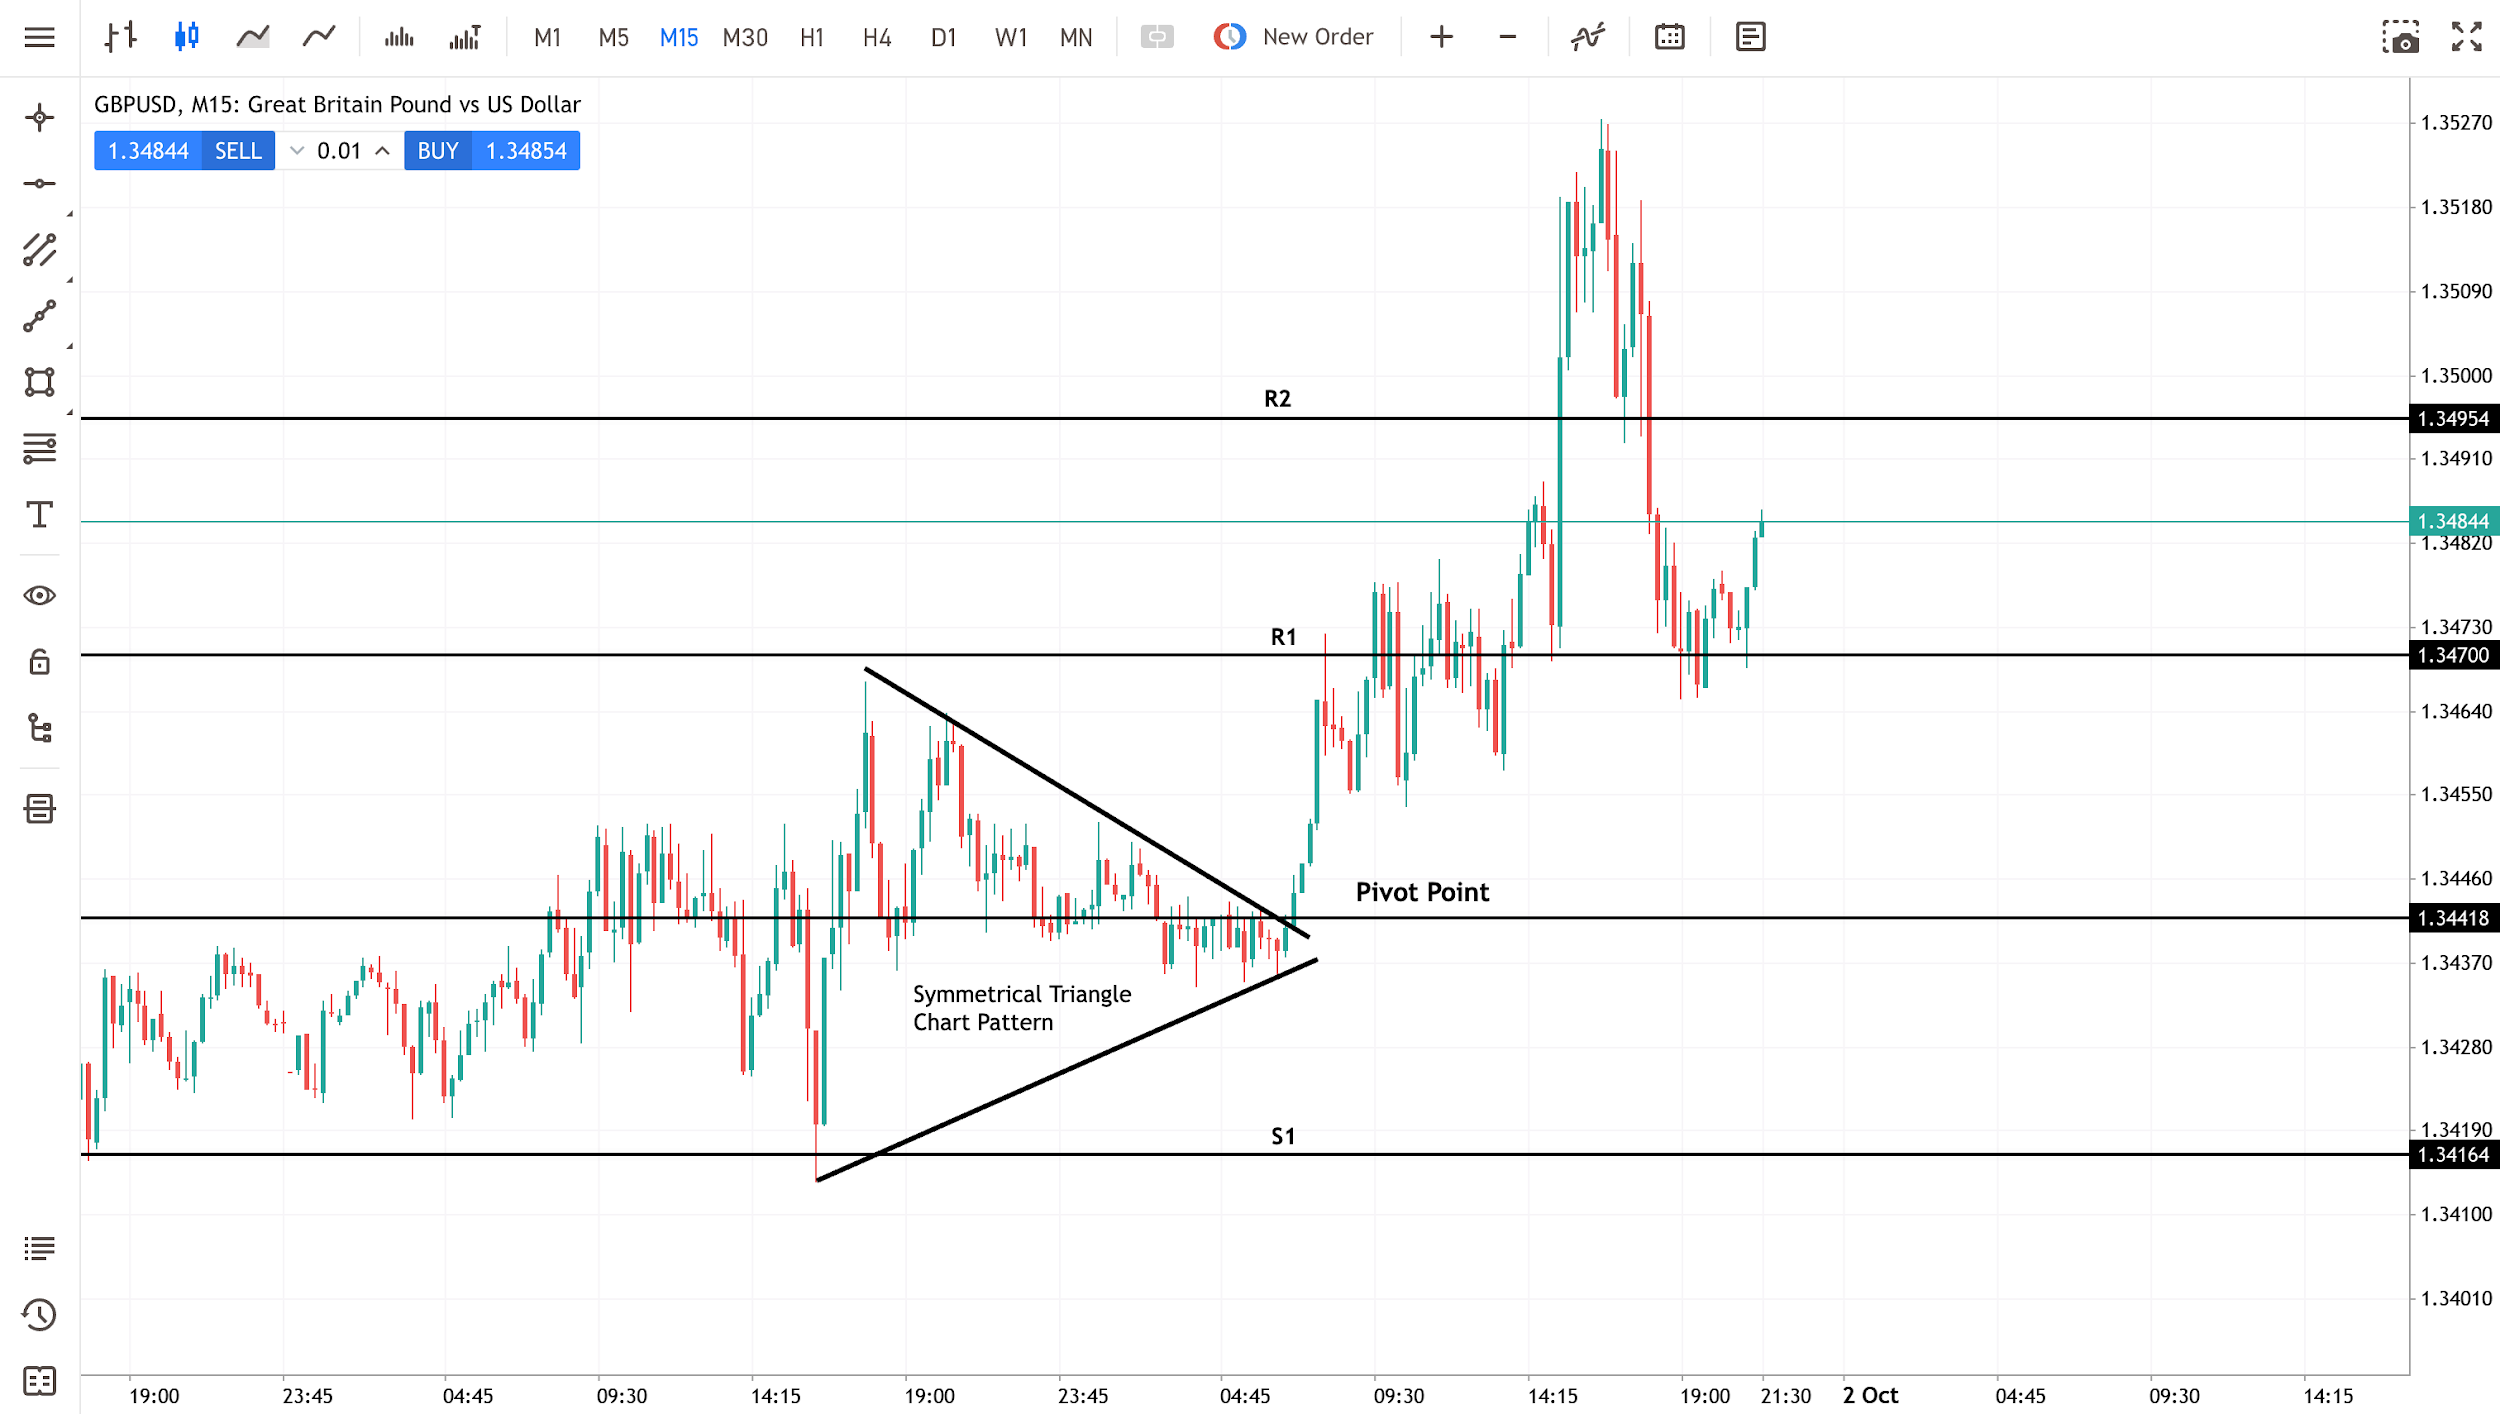
For instance, the GBPUSD setup above was forming a clear symmetrical triangle chart pattern on the 15-minute timeframe. Naturally, a trader would get ready to trade the breakout.
So, what happened? Price broke out to the upside while also breaking above the pivot point for the day. Instead of one entry signal, we now have two, which makes the trade to the upside even more compelling.
As for target profits, we can either target the nearest pivot point, R1 or R2. It’s as simple as that.
3. Use Other Technical Indicators for Confluence
Just like the previous example, it’s not far-fetched to say that pivot points become more powerful when combined with other day trading technical indicators.
While you can combine it with different trading indicators and confluences, we suggest that you go with a simple approach. Remember, “simple strategies beat complex ones every single time.”
So, for our illustration, let’s combine the pivot point with an exponential moving average (EMA). This combo helps determine trend direction, and pivot levels can confirm or contradict that trend. The more independent signals align at a pivot level, the stronger the trade idea.
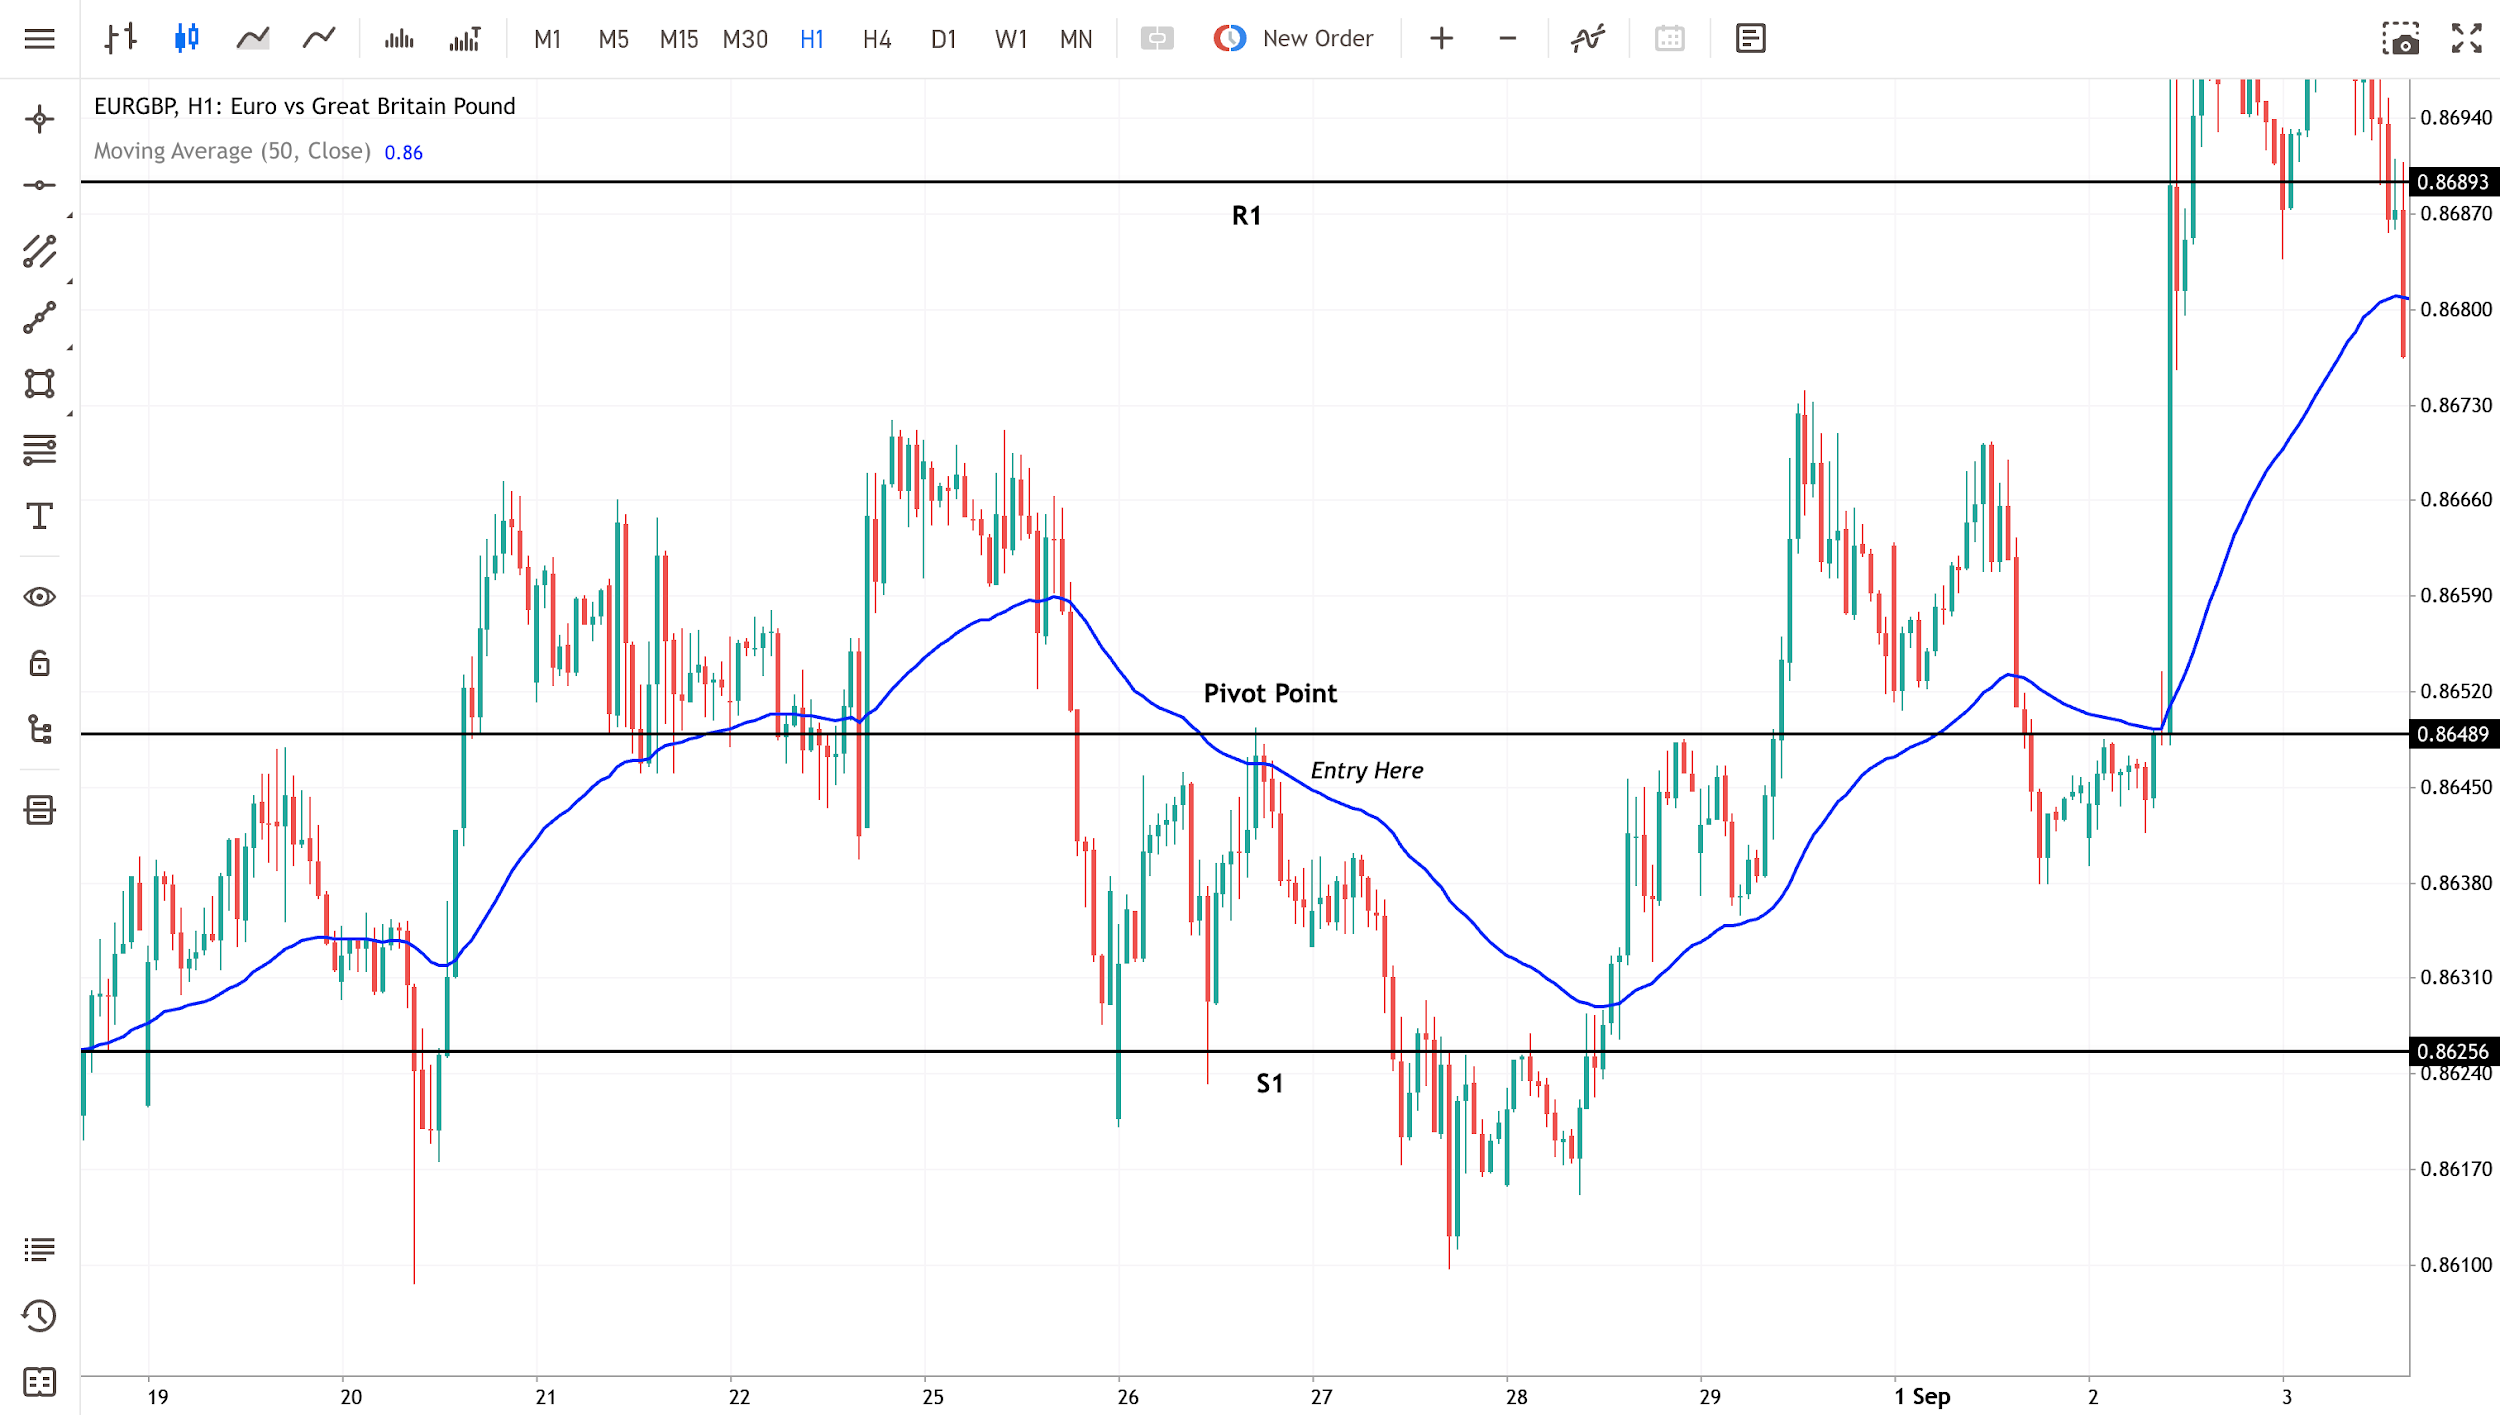
As you can see in the EUR/GBP chart above, the price had crossed below both the pivot point for the day and also the 50 EMA, showing an impressive bearish intention in the market.
To enter our sell position, we only need the price to retest the pivot point and the 50 EMA. Simultaneously, we can wait for the price to close below the EMA before pulling the trigger.
Why Is the Pivot Point Strategy So Effective?
Because it’s simple, logical, and widely followed. Let’s break that down.
First, pivot points are derived from something every trader already understands - yesterday’s high, low, and close. That’s why they feel so intuitive since you're using a framework built directly on how the market behaved just one session ago.
Second, they bring structure into an otherwise messy chart. Instead of guessing where price might stall, you’ve got predefined levels: PP, R1, S1, R2, S2. If price hits R1 and reacts, you know you’re not the only one seeing it. Which leads to the next point…
Third, popularity matters. Thousands of traders, retail and institutional, watch these levels every single day. That creates a self-fulfilling effect. If enough buyers pile in at S1, chances are the price will bounce because everyone agrees to play the same game.
Finally, pivots blend beautifully with other tools. Combine them with trendlines, moving averages, or Fibonacci retracements strategies, and suddenly you’ve got confluence. When two or more signals overlap at one price level, that’s usually where the market makes its move.
In short, pivot points work because they simplify decision-making, they’re trusted by the crowd, and they fit naturally into any trading strategy. These significantly tilt the odds in your favor, and in trading, that’s everything.
Wrapping Up
If you’ve made it this far, give yourself a pat on the back. We’ve covered a lot: the basics of pivot points in trading, how to calculate them manually or with a calculator, different variants like Fibonacci, Woodie, Camarilla, and Demark, several pivot point trading strategies, and the pros and cons.
Overall, pivot points provide objective support and resistance levels and can help you plan entry and exit points. When combined with other technical indicators and sound risk management techniques, they become a powerful part of your trading toolbox.
But remember, they are guidelines, not guarantees. Backtest them on your favourite markets using a demo account, notice how they interact with price, and adapt your strategy accordingly. Markets sometimes respect the pivot levels; sometimes they ignore them. Pivot points are there to provide structure, not certainty. Use them with an open mind and, above all, manage your risk.
FAQs
Here are some frequently asked questions and our honest answers to them:
How to calculate pivot points in day trading?
For day trading, use the previous day’s high, low, and close. Calculate the pivot point with (H + L + C) / 3. Then derive support and resistance levels: R1 = (2 × PP) − L, S1 = (2 × PP) − H, R2 = PP + (H − L), and S2 = PP − (H − L). Plot these levels on your intraday chart.
What is the success rate of the pivot points trading strategy?
There isn’t a single, fixed success rate. Pivot points are not a standalone “system”; they’re a tool for identifying support and resistance and gauging market sentiment.
Success depends on market conditions, discipline, risk management, and combining pivot points with other indicators. Think of pivot points as part of a larger strategy rather than a magic bullet.
How to use pivot points in swing trading?
Swing traders often use weekly or monthly pivot points. Pivot points on 30‑, 60‑, and 120‑minute charts generally use the prior week’s high, low, and close, while daily charts use the prior month’s data.
Calculate the weekly pivot as the average of last week’s high, low, and close, then derive support/resistance levels as you would for daily pivots. These levels remain fixed for the entire week and can guide your swing trades.
Risk Disclosure: The information provided in this article is not intended to give financial advice, recommend investments, guarantee profits, or shield you from losses. Our content is only for informational purposes and to help you understand the risks and complexity of these markets by providing objective analysis. Before trading, carefully consider your experience, financial goals, and risk tolerance. Trading involves significant potential for financial loss and isn't suitable for everyone.