What is Seasonality in Commodity Trading, And How Can You Use This Strategy
Commodity prices flow with the seasons. Farmers plant and harvest at specific times, families switch on heaters in the winter and hop into cars for summer road trips, and factories ramp up construction. These basic patterns create recurring seasonal trends in commodity markets.
In this guide, we’ll share what we’ve learned from years of watching the corn belt’s drought rallies, winter gas spikes, and the surge in copper demand when builders break ground in spring.
We’ll also explore why seasonality exists, look at concrete examples, discuss why and how traders use seasonal strategies, and review practical ways to implement them with instruments like futures CFDs. Let’s get started.
What Is Commodity Seasonality in Trading?
Seasonality refers to recurring seasonal patterns in commodity prices caused by biological cycles, weather, and consumer habits.
For instance, grain futures reflect the planting, growing, and harvest rhythm: supply is tight in the “old crop” months when last year’s harvest is nearly exhausted, and abundant in “new crop” months when the next harvest hits the market. In old‑crop months, prices often trade higher because inventories are limited; after harvest, when supply surges, prices typically fall.
Energy commodities also display pronounced seasonality. The U.S. Energy Information Administration (EIA) notes that U.S. natural gas consumption peaks in winter and summer, reflecting demand for heating and air conditioning.
Metals aren’t immune either. Usually, copper prices tend to bottom in late November/December and peak around April or May because miners and manufacturers build inventories ahead of the construction season. Also, copper prices tend to rise from late December to late March when heating and insulation demand increases, then stabilise during summer before rising again in autumn.
At first glance, seasonality may seem like a crack in market efficiency, but it largely reflects tangible supply and demand cycles.
Seasonal patterns are grounded in basic economics: crops are planted and harvested at set times, people burn more heating fuel in winter, and drivers hit the road in summer.
Farmers and energy companies reinforce these patterns by hedging: before harvest, they sell futures to lock in prices, which creates predictable supply pressure, and utilities buy winter natural gas contracts to secure inventories, boosting demand. These behaviours create visible rhythms that persist despite modern markets.
Climate change also introduces negative seasonality, such as drought‑driven volatility clusters during planting or harvest windows. In other words, seasonality is real but not set in stone, so traders must adapt.
Seasonal patterns are grounded in basic economics: crops are planted and harvested at set times, people burn more heating fuel in winter, and drivers hit the road in summer.
Examples of Commodity Seasonality
It helps to see how seasonality plays out in specific markets. Below are some examples, along with the fundamental drivers and typical time windows.
Agricultural Commodities: Corn, Soybeans, and Wheat
Grain prices are perhaps the most classic case of harvest cycles driving seasonality. Corn and soybean prices often peak around July because uncertainty about the new crop is highest.
As the crop matures, the market gains confidence and prices decline into the harvest months of September – November. After harvest, when bins are full, prices often remain subdued until the supply pipeline tightens again.
Wheat exhibits a slightly different pattern because there are multiple harvests. Winter wheat harvests occur in July, spring wheat harvests around August – September, and Southern Hemisphere harvests in December – January. Wheat prices typically decline into the July harvest and then begin to recover through autumn and winter.
Corn prices drop during the September – October North American harvest, and the seasonal window for corn strength is June – July. Brazilian soybeans harvested between February and May buffer the U.S. fall harvest, reducing the October price drops from around 20 % in the 1980s to 10 – 12 % today.
For more information, you can visit our guide on how to trade soft commodities.
Energy Commodities: Natural Gas, Heating Oil, and Crude Oil
Demand swings strongly influence energy commodities. As the EIA’s data shows, U.S. natural gas consumption spikes in winter (January–February) due to heating needs and again in summer (July – August) because of air‑conditioning demand.
Conversely, consumption declines during mild spring months. Traders who buy natural gas futures ahead of these peaks and sell as demand eases can potentially gain from these predictable patterns. It is important to note that the seasonal window of greatest strength for natural gas prices is December – February.
Crude oil and gasoline follow travel habits. Many drivers plan road trips from May through August, causing gasoline demand (and prices) to rise. Heating oil demand peaks during the winter months.
On the other hand, natural gas and heating oil prices reach highs during December – February, drop in spring, show a secondary rise in summer for cooling demand, and build again in autumn as storage injections begin.
Metals and Industrial Commodities
Metal markets can be surprisingly seasonal. Construction and manufacturing schedules create recurring demand cycles.
Copper prices often rise from late December through late March due to heating and insulation demand, slip in April, remain stable through the summer, and then rise again in November. These cycles are linked to construction activity, heating needs, and holiday electronics demand.
The table below illustrates how seasonal trends differ across commodities, but it also hints at a common theme: predictable patterns often stem from physical constraints and human behaviour.
As you can see, during harvest season, when fields are buzzing with combines and trucks, supplies flood the market and prices tend to languish until inventories are worked down.
Keeping an eye on this seasonal glut helps traders avoid chasing rallies at precisely the wrong moment.
How to Trade Commodity Seasonality
Seasonal trading is a disciplined process of analysing data, timing entries, managing risk, and choosing the right instruments. Here’s a step‑by‑step framework drawn from research and our experience.
1. Gather and Analyse Historical Data
Reliable seasonal analysis requires at least 5 – 10 years of data, calculating seasonal indexes (average price movements for specific periods) and using volume analysis.
When building a seasonal index, many traders divide each month’s average price by that year’s average to see relative strength or weakness. This helps normalise periods across different market regimes.
2. Confirm the Pattern’s Significance
Not all seasonal patterns are worth trading. Look for patterns that have appeared in more than 70% of years and are backed by a strong fundamental driver.
Correlation testing across multiple years helps ensure the pattern isn’t random. Focusing on markets whose seasonal patterns correlated positively with price improved performance.
3. Plan Your Trading Strategies and Entries
Timing matters. Seasonal trades often need to be entered a few weeks before the typical price move begins. Entering positions 2 – 3 weeks before traditional seasonal peaks is generally encouraged.
Rather than buying or selling outright, consider calendar spreads. Selling December corn and buying July corn during September – October allows traders to isolate the seasonal component while neutralising broad market moves. Spreads can also help when markets are in contango (future prices above spot) because they reduce the cost of rolling contracts.
4. Choose the Right Instruments: Futures, CFDs, or ETFs
Traditionally, seasonal traders use commodity futures markets because they offer high liquidity and direct exposure. But futures contracts require large margin deposits and involve rolling positions to avoid delivery. If you’re a smaller trader or don’t want physical delivery, trading CFDs and commodity sector ETFs can provide alternative exposure.
Crucially, our platform offers futures CFDs with different expiration dates on a range of commodities. Because each CFD corresponds to a particular expiry month, you can construct seasonality strategies such as:
- Front‑month vs. deferred‑month spread: Buy a near‑dated CFD and sell a far‑dated CFD when you expect the front month to benefit from a seasonal demand spike. For example, going long on January natural gas and short on April natural gas in December to capture winter heating demand.
- Roll timing strategy: Enter a CFD position a few weeks before the expected seasonal move, then roll to the next expiry as the pattern unfolds. Using CFDs means the roll is automatically handled by the broker, eliminating the need to close and reopen futures contracts.
5. Combine Seasonality with Other Tools
Seasonal patterns are best used as part of a broader strategy. Combine them with fundamental analysis (crop conditions, weather forecasts, storage levels), technical indicators (trend lines, support/resistance), and sentiment indicators such as Commitments of Traders reports.
External factors like economic conditions, supply disruptions, and global trade patterns can affect typical seasonal movements, so staying informed is essential.
How to Find Commodity Spread Quotes and Charts
Perhaps one of the biggest challenges of trading commodity seasonality is finding the right data. To explore how commodity seasonality works, you must first identify the appropriate contracts to examine and the spread between different expiration dates.
For instance, historically, the July-December corn spread has been influenced by seasonality. This spread often shows seasonal movement as markets transition from the old crop to the new one. During late spring and early summer, the July contract typically weakens compared to December as traders focus on the upcoming harvest and new crop supply. However, when old crop inventories become unusually tight, like in early 2025, the spread can strengthen sharply, reflecting short-term supply pressures.
For example, in the chart below, you can see the Corn July 26-Corn December 26 spread. As of now, the spread stands at -9; however, this spread is likely to widen over the next few months.
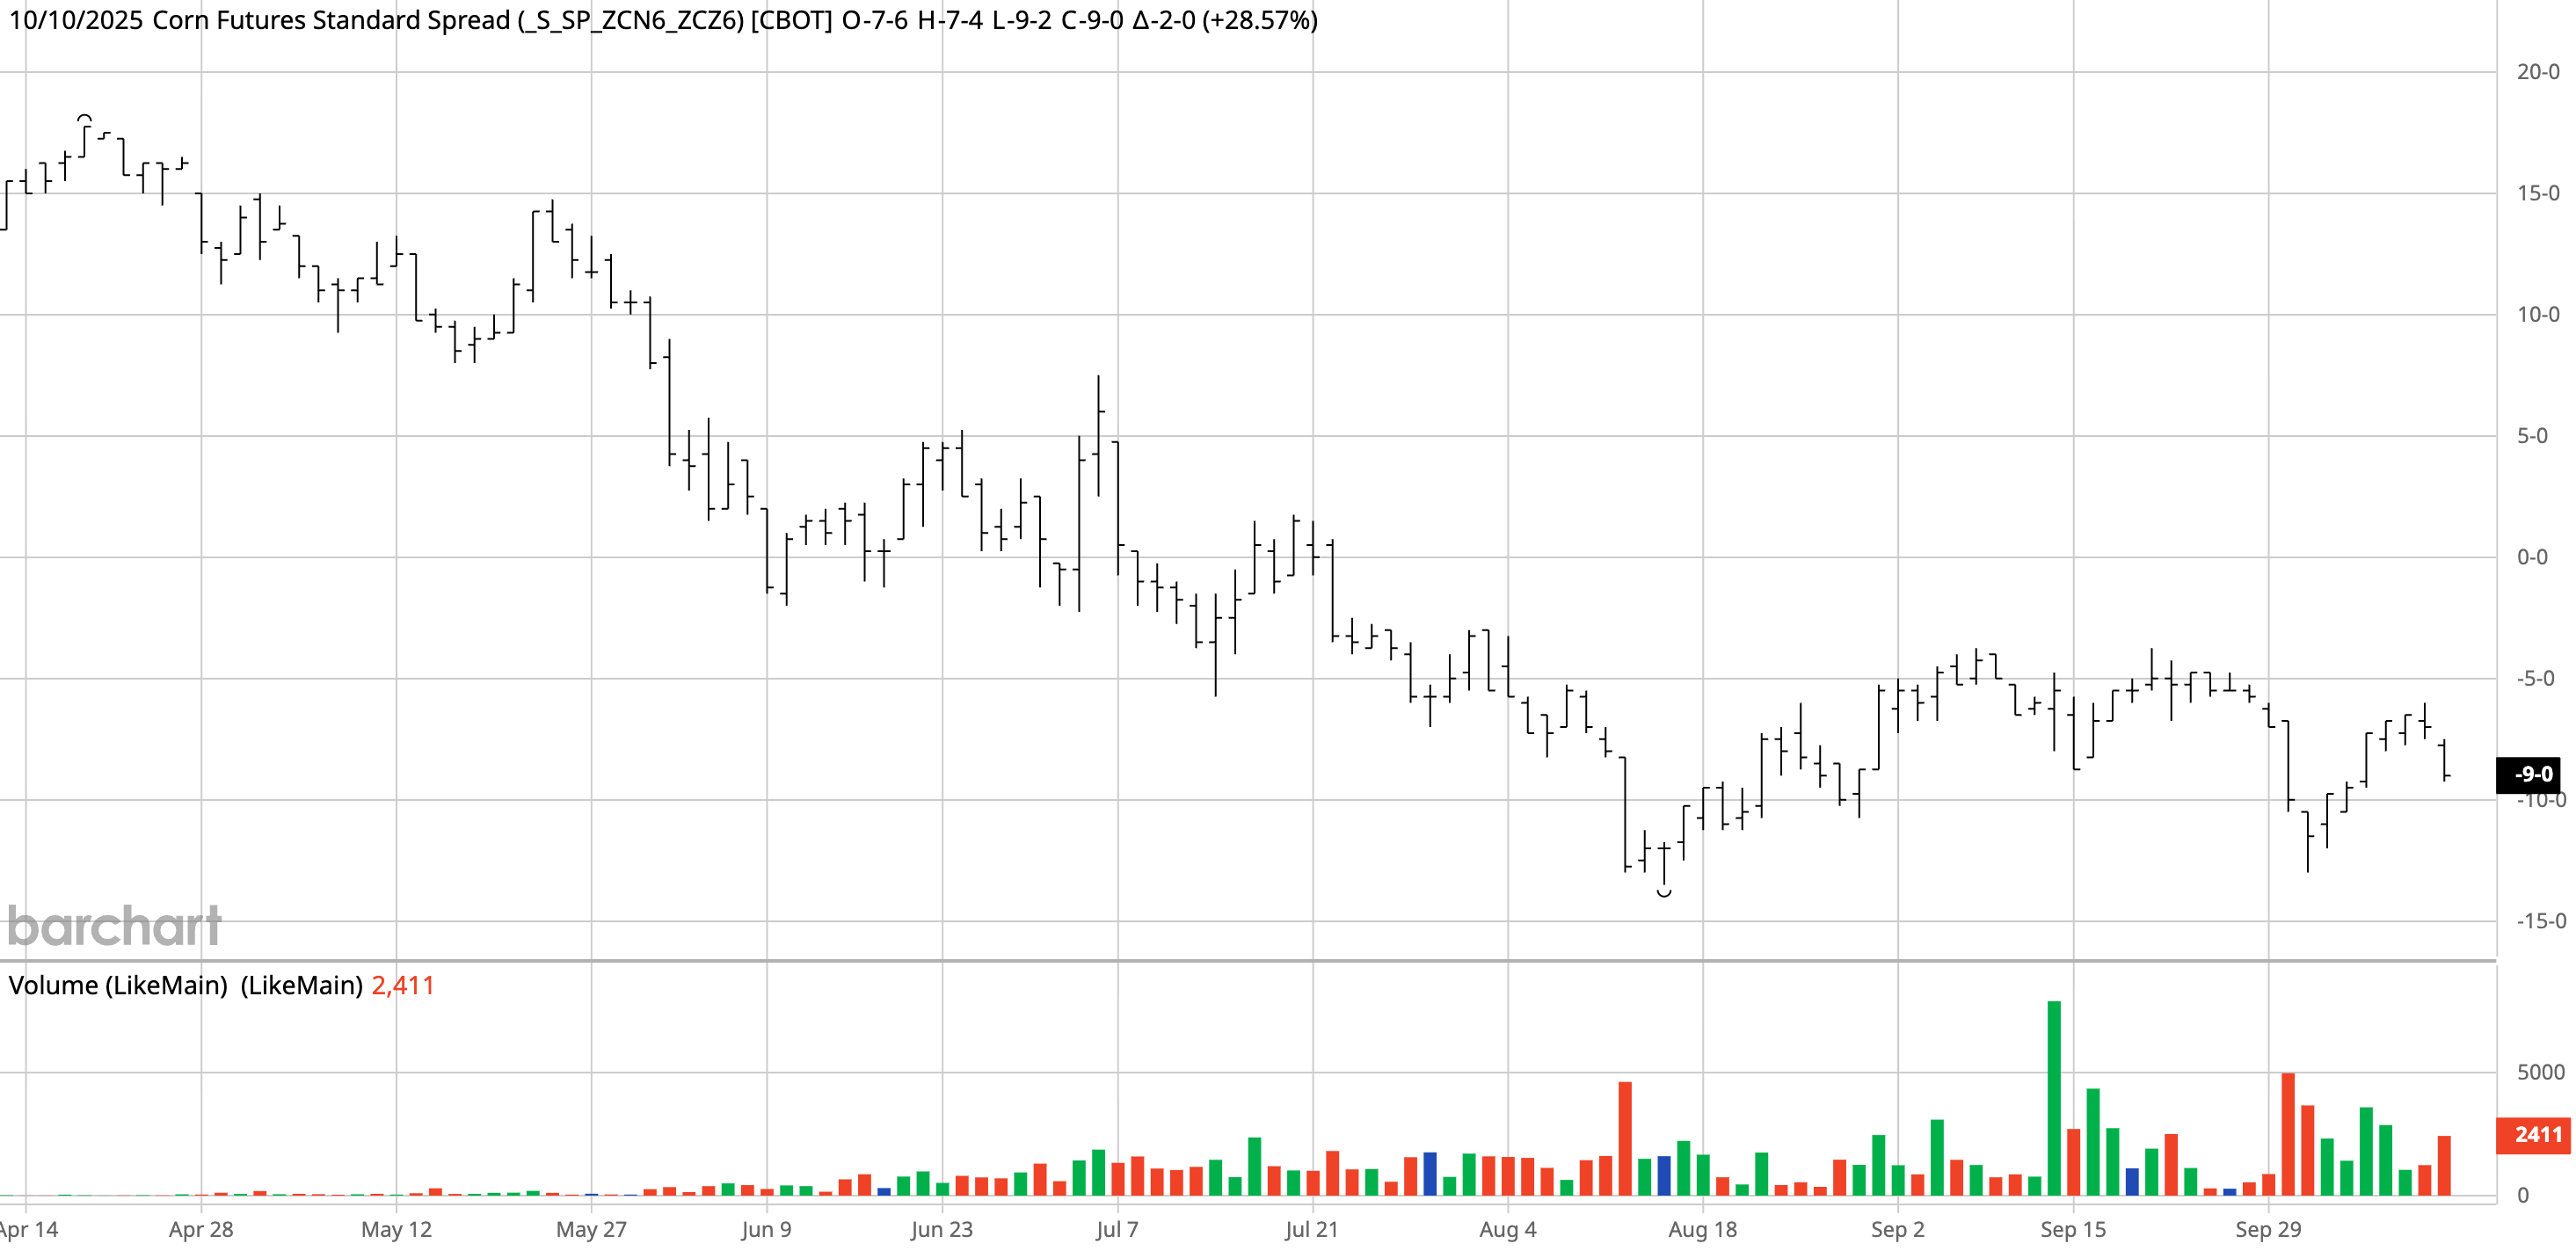
This is a classic case of commodity seasonality. Unless there is something ‘unpredictable’ happening in the Corn market, the spread tends to move in the same direction every year. And many professional prop firm traders are aware of that. They often take advantage of that by using the same strategy every year.
Now, for the tricky part - finding commodity spread charts. So, if you do not have a trading platform dedicated to futures trading, then it's not likely for you to get access to spread quotes and charts. (Luckily, on Switch Markets, you can use PineConnector, which allows you to connect your TradingView account to MT5). To find commodity spread quotes, you can use platforms like BarChart or the CBOE. Either way, you'll have to learn the symbols of each month in order to follow spreads that have more volume and are likely to be influenced by seasonality.
On TradingView, you can use this formula to find commodity spread charts. ZCN26 (Corn July contract+year) - ZNZ26 (Corn December contract+year). It should look like that - ZCN2026 - ZCZ2026. The same applies to wheat - ZWN26 (Wheat July contract+year) - ZWZ26 (Wheat December contract+year).
Wrapping Up
In sum, Seasonal trading is both an art and a science. It starts with an appreciation of how planting calendars, weather, and human behaviour create predictable patterns in commodity markets.
As we’ve seen, corn tends to rally in late spring and fall during harvest; natural gas spikes in winter and again in summer; copper prices often bottom in winter and peak in spring; and gasoline prices rise with summer driving.
Yet these patterns aren’t carved in stone. Global supply chains, financial speculation, and climate change have compressed swings and introduced volatility clusters.
Used thoughtfully, seasonality can help traders anticipate price movements, manage risk, and diversify their portfolios.
Want to test it out yourself? Open an account with us now and get started.
FAQs
We’ve covered a lot of ground, but some questions come up over and over again whenever seasonality is discussed. Let’s tackle a few of the most common ones to clear up any lingering doubts.
What is seasonality in commodity trading, and why does it matter?
Seasonality refers to recurring price patterns in commodities driven by supply and demand cycles, weather, and consumer behaviour.
How can I identify and confirm seasonal trends?
Start by collecting at least 5–10 years of historical price data and calculating a seasonal index. Look for patterns that recur in more than 70 % of years and are supported by a fundamental driver such as harvest cycles or heating demand. Correlate the pattern with multiple years to ensure it’s not random, and use technical indicators like moving averages or momentum oscillators for confirmation.
What are the risks of trading seasonality, and how do I manage them?
Seasonal trades can fail due to unexpected weather, geopolitical events, or shifts in supply chains. Use small position sizes (1–2 % of capital), place stop‑loss orders outside normal seasonal ranges, and aim for profit targets two to three times the risk. Consider using spreads or options to isolate the seasonal component and reduce exposure to broad market moves. And always, backtest your strategy on a demonstration account before you risk your capital in live markets.
Risk Disclosure: The information provided in this article is not intended to give financial advice, recommend investments, guarantee profits, or shield you from losses. Our content is only for informational purposes and to help you understand the risks and complexity of these markets by providing objective analysis. Before trading, carefully consider your experience, financial goals, and risk tolerance. Trading involves significant potential for financial loss and isn't suitable for everyone.