Monte Carlo Simulation in Trading: What It Is and How to Use It
- What Is Monte Carlo Simulation in Trading?
- Why Traders Use Monte Carlo Methods Instead of Just a Backtest
- How Monte Carlo Simulation Works for a Trading Strategy
- Types of Monte Carlo Methods Used in Trading
- Reading Monte Carlo Equity Curves and Key Risk Metrics
- How Many Simulations Are Enough? (And Other Practical Settings)
- How to Use the Switch Markets Monte Carlo Simulator (Step by Step)
- Case Study: Monte Carlo on a Simple Forex Strategy (Realistic Scenario)
- Using Monte Carlo Simulation in Algorithmic Trading and AI Trading
- What Matters Most When Interpreting Monte Carlo Results
- Common Issues When Applying Monte Carlo Simulation to Trading
- How to Get Started: Tools, Data, and a Simple Workflow
- FAQ
Running a single backtest gives you one version of reality. Monte Carlo simulation in trading gives you thousands. By reshuffling your historical trades across randomized sequences, you can map the full range of what might happen to your account-not just what did happen once. This guide walks you through the theory, the workflow, a realistic forex case study, and the practical decisions that Monte Carlo results should drive.
Key Takeaways
What Is Monte Carlo Simulation in Trading?
A Monte Carlo simulation uses repeated random sampling-typically 1,000 to 10,000 runs-to model the probability distribution of possible outcomes for a trading strategy. So instead of looking at one backtest, each simulation randomly determines the order of your winning trades and losses, building a fresh equity curve every time. The result is a map of potential outcomes rather than a single "most likely" path.
In trading, Monte Carlo analysis is used to:
- Quantify drawdown risk under different trade sequences
- Estimate the probability of ruin (the chance of significant account loss before your edge plays out)
- Understand the distribution of final returns across percentiles (5th, 50th, 95th)
- Stress-test assumptions about win rate, risk ratio, and trade frequency
Historically, the Monte Carlo method traces back to the 1940s, when John Von Neumann and Stanislaw Ulam developed random sampling techniques for nuclear physics. The name evokes casino randomness-fitting, since these methods model how random variables shape different outcomes in complex systems. Monte Carlo simulations are versatile and used in various complex applications, from data science and sensitivity analysis to pricing options with path-dependent structures.
It's worth noting that Switch Markets offers one of the most accurate and user-friendly Monte Carlo simulators available for traders. Rather than building complex spreadsheets or writing code, you can run thousands of simulations in just a few clicks using real trading assumptions such as win rate, risk-to-reward ratio, account balance, and risk per trade. Throughout this guide, you'll learn how Monte Carlo simulation works, why it's such a powerful risk management tool, and how to apply it to your own trading strategy using the Switch Markets Monte Carlo Calculator.
Why Traders Use Monte Carlo Methods Instead of Just a Backtest
A single backtest produces one equity curve from one historical sequence. Monte Carlo reshuffles or resamples that P&L history to expose hidden risks that a backtest alone cannot reveal. Here's why professional traders use it:
- Sequence risk exposure: A backtest's maximum drawdown can be misleading. Monte Carlo analysis can show potential maximum drawdowns of 3.1 times backtest values. A strategy showing −12% in a backtest may reveal −25% to −30% drawdowns in worst-case simulated paths.
- Edge vs. luck: Monte Carlo helps distinguish a winning strategy from a lucky backtest by showing how sensitive strategy performance is to trade order.
- Risk metrics beyond average returns: Carlo simulation reveals the distribution of max drawdowns, risk of ruin, standard deviation of returns, and variability in final equity after N trades.
- Psychological preparation: Traders can better prepare for losing streaks using Monte Carlo simulations. Knowing that 10–12 consecutive losses are plausible helps professional traders stick with a valid system during rough patches.
- Integration with advanced validation: Algorithmic trading desks routinely run Monte Carlo simulations alongside walk-forward tests, out-of-sample tests, and machine learning validation pipelines.
The reasons above can help you understand why Monte Carlo simulation has become one of the most important risk management tools in modern trading. Rather than relying on a single backtest, it helps traders understand the full range of possible outcomes and make decisions based on probabilities instead of hope.
How Monte Carlo Simulation Works for a Trading Strategy
Many beginner traders assume that Monte Carlo simulation is a complex tool reserved for quantitative analysts or professional traders. In reality, it's surprisingly straightforward once you understand the basic concepts and how it works. Here is the step-by-step workflow most trading systems use:
Here is the step-by-step workflow most trading systems use:
- Step 1 – Collect historical data: Gather individual trade results from a backtest, trading journal, or broker statement. You need at least 200–300 historical trades for reliability; fewer than ~100 trades produce very noisy results.
- Step 2 – Compute trade statistics: Calculate win rate, average win, average loss, risk-reward ratio, and expected value per trade. The EV formula: EV = (win rate × average win) − (loss rate × average loss).
- Step 3 – Choose your method: Select between reshuffling without replacement, resampling with replacement (bootstrap), or parametric simulation based on fitted distributions. Each answers slightly different questions.
- Step 4 – Run each simulation: The simulation randomly determines a sequence of trade wins and losses, updates account balance trade by trade, and stores the full equity curve-not just the final P&L. Input initial balance, risk percentage, and win percentage to configure each run.
- Step 5 – Repeat thousands of times: Run Monte Carlo simulations at least 1,000 iterations; 5,000–10,000 for precise tail-risk metrics. Monte Carlo simulations can run over 1,000 iterations to build a robust probability distribution.
- Step 6 – Summarize with percentiles: Extract the 5th percentile (realistic worst case), 50th percentile (median expectation), and 95th percentile (optimistic scenario) for final balance, max drawdown, and other important performance metrics.
You can replicate this process using the SwitchMarkets Monte Carlo simulator by entering your win rate, R:R, risk per trade, and how many trades to simulate.
Types of Monte Carlo Methods Used in Trading
Different Monte Carlo methods are used depending on what you want to measure, from simple drawdown behavior to more realistic market-like simulations.
Sampling without Replacement (Trade Shuffling)
This method takes your existing historical trades and simply reshuffles them in a different order. The win/loss distribution stays exactly the same, but the sequence changes. It’s useful for seeing how different trade orders affect your equity curve and how large your drawdowns could become even with the same strategy results.
Sampling with Replacement (Bootstrap)
This method randomly selects trades from your history, but each trade can be picked more than once. Because of this, it creates a wider range of possible outcomes, including more extreme scenarios. It’s one of the most commonly used Monte Carlo methods because it gives a realistic view of uncertainty and variability in performance.
Parametric Monte Carlo simulation
Instead of using your actual trades, this method builds a statistical model of your returns (for example, normal, lognormal, or heavy-tailed distributions) and generates synthetic outcomes from it. It’s often used when modeling price paths directly, such as in options pricing or when simulating how an underlying asset might move over time.
Block Bootstrapping and Regime-Based Methods
This approach keeps groups of trades together instead of mixing everything randomly. That helps preserve patterns like streaks, trends, or volatility clustering. It’s especially useful for strategies where trades are not independent, such as trend-following systems where winning or losing streaks tend to occur in clusters.
Reading Monte Carlo Equity Curves and Key Risk Metrics
Plotting 50–100 equity curves from thousands of simulations creates a visual "cone" of possible account paths. Monte Carlo simulations generate thousands of randomized equity curves, and interpreting them correctly is what separates quantitative analysis from guesswork. For some, this display could be quite confusing. So here's what you need to know to learn how to read Monte Carlo outputs:
Key outputs to focus on:
Median Final Balance
The median final balance is the outcome that sits exactly in the middle of all your simulations. Half of the simulations finish with a higher account balance, while the other half finish with a lower one. Unlike an average, which can be skewed by a few extremely good or bad results, the median gives you a more realistic expectation of what your trading account could look like after completing the simulated trades.
5th and 95th Percentile Final Balances
The 5th and 95th percentile balances help you understand the range of likely outcomes. The 5th percentile represents a pessimistic but still realistic scenario; only about 5% of simulations perform worse. The 95th percentile represents an optimistic outcome, with only 5% of simulations performing better. Looking at these values together gives you a much better understanding of the uncertainty surrounding your trading strategy than relying on a single projected return.
Median Maximum Drawdown
The median maximum drawdown shows the typical largest decline your account experiences during the simulations before recovering. This is one of the most important risk metrics because it tells you how much of your capital you may need to withstand during difficult periods. In many cases, Monte Carlo simulations reveal drawdowns that are much larger than those seen in a traditional backtest, helping traders prepare for more realistic market conditions.
Worst Losing Streaks
Every profitable trading strategy experiences losing streaks. Monte Carlo simulation estimates the longest sequence of consecutive losing trades that could realistically occur. This information is valuable because it helps traders prepare mentally and financially for inevitable periods of poor performance. Understanding that a long losing streak is statistically possible makes it easier to stick to your trading plan instead of abandoning a strategy that still has a positive long-term edge.
Risk of Ruin
The risk of ruin measures the probability that your trading account falls below a critical level, such as losing 50% of its value or reaching another predefined threshold. Rather than looking only at where your account finishes, this metric considers whether your balance drops to a dangerous level at any point during the simulation. A high risk of ruin often indicates that position sizes are too large or that the trading strategy carries more risk than the trader can comfortably manage.
Value at Risk (VaR)
Value at Risk (VaR) estimates how much your portfolio could lose over a given period under normal market conditions and with a specified level of confidence. For example, a one-day 95% VaR estimates the maximum loss you would expect on 95% of trading days, while acknowledging that larger losses are still possible. Monte Carlo simulation is widely used to calculate VaR because it can model thousands of different market scenarios, giving traders and portfolio managers a more comprehensive view of potential downside risk.
Professional traders use Monte Carlo equity curve "bands" to monitor a live equity curve in real time. If your actual account tracks below the 5th percentile band early on, something may be wrong-execution issues, regime shift, or cost overruns degrading your edge.
How Many Simulations Are Enough? (And Other Practical Settings)
So, the real question is how many simulations you need to find the perfect outcome? Well, that largely depends on the level of precision you’re aiming for. Current industry benchmarks (2024–2026) suggest that around 1,000 simulations are generally sufficient to produce stable estimates for median outcomes and the 5th percentile, making them reliable for most basic risk assessments. When more precision is required, especially for tail-risk metrics such as 99th percentile drawdowns or extreme probabilities of ruin, it is recommended to run between 5,000 and 10,000 simulations.
The number of historical trades in your strategy also matters. If your system has fewer than approximately 150 past trades, Monte Carlo results tend to be noisier and should be interpreted with caution, as the sample size may not fully represent long-term performance. In addition, the simulation horizon should align with your trading style. For example, around 250 trades may be appropriate for active day trading strategies as well as scalp trading, while roughly 100 trades may be more suitable for swing trading approaches.
It’s also important to remember that the accuracy of the simulations depends heavily on the quality of the input data. Key assumptions such as win rate and risk-to-reward ratio should be derived from robust historical performance, and small differences in outputs like expected value or drawdown should not be over-interpreted if they fall within normal statistical noise.
The SwitchMarkets online Monte Carlo simulator allows you to easily explore how increasing the number of simulations - from 500 to 1,000 or more - helps stabilize key metrics such as risk of ruin and median account balance.
How to Use the Switch Markets Monte Carlo Simulator (Step by Step)
You don’t need Python or a spreadsheet to run your first simulation. The Switch Markets Monte Carlo simulator can do everything you want from inside your browser: all you need to do is to simply enter your trade statistics, set your risk, and read the distribution of outcomes in seconds.
To keep this walkthrough grounded, we model the same realistic edge as the case study below (a 52% win rate and a 1.6:1 reward-to-risk ratio). Here is the full workflow, from blank form to interpreted results:
Step 1: Enter Your Account and Strategy Inputs
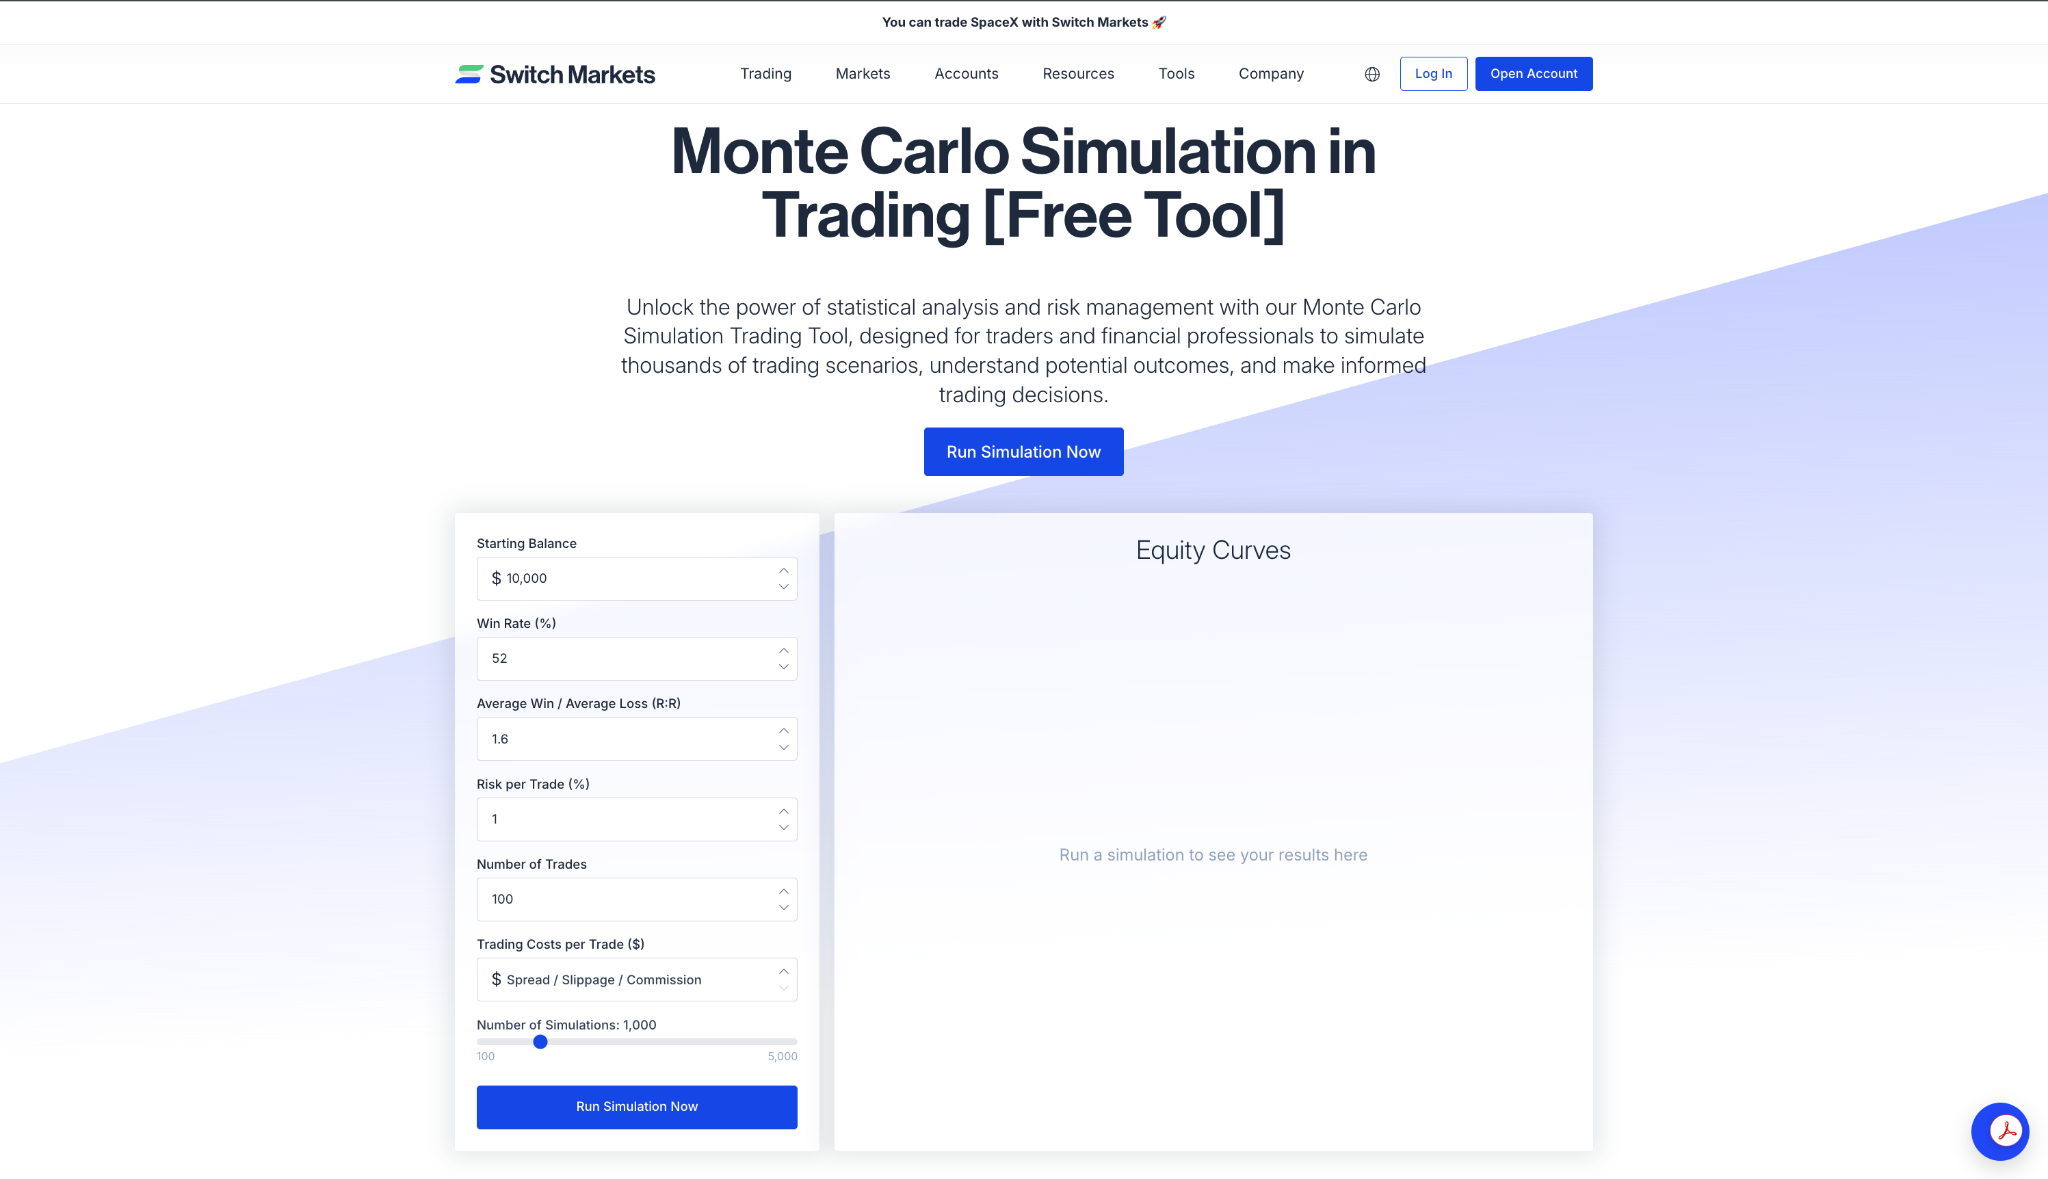
The left-hand panel contains seven fields. Simply enter the realistic strategy profile inside those fields. It’s important to note that each field maps to a statistic you should pull from your own trading journal or backtest:
- Starting Balance: The account equity you want to model.
- Win Rate (%): The share of your trades that close in profit. Draw this from at least 200 – 300 real trades, not a hopeful guess.
- Average Win / Average Loss (R:R): Your reward-to-risk ratio, the size of your average winner relative to your average loser.
- Risk per Trade (%): The percentage of equity you risk on each position. Most durable systems sit between 0.5% and 1.5%.
- Number of Trades: The horizon for each run. Roughly 100 suits swing trading; use 250 for active day trading. There’s no right or wrong way here; just start with what is reasonable to you.
- Trading Costs per Trade ($): Spread and commission drag per trade. Including it keeps results honest.
- Number of Simulations: The slider runs 100 to 5,000 randomized paths. Leave it at 1,000 for stable medians; push it to 5,000 for cleaner tail-risk numbers.
Step 2: Run the Simulation
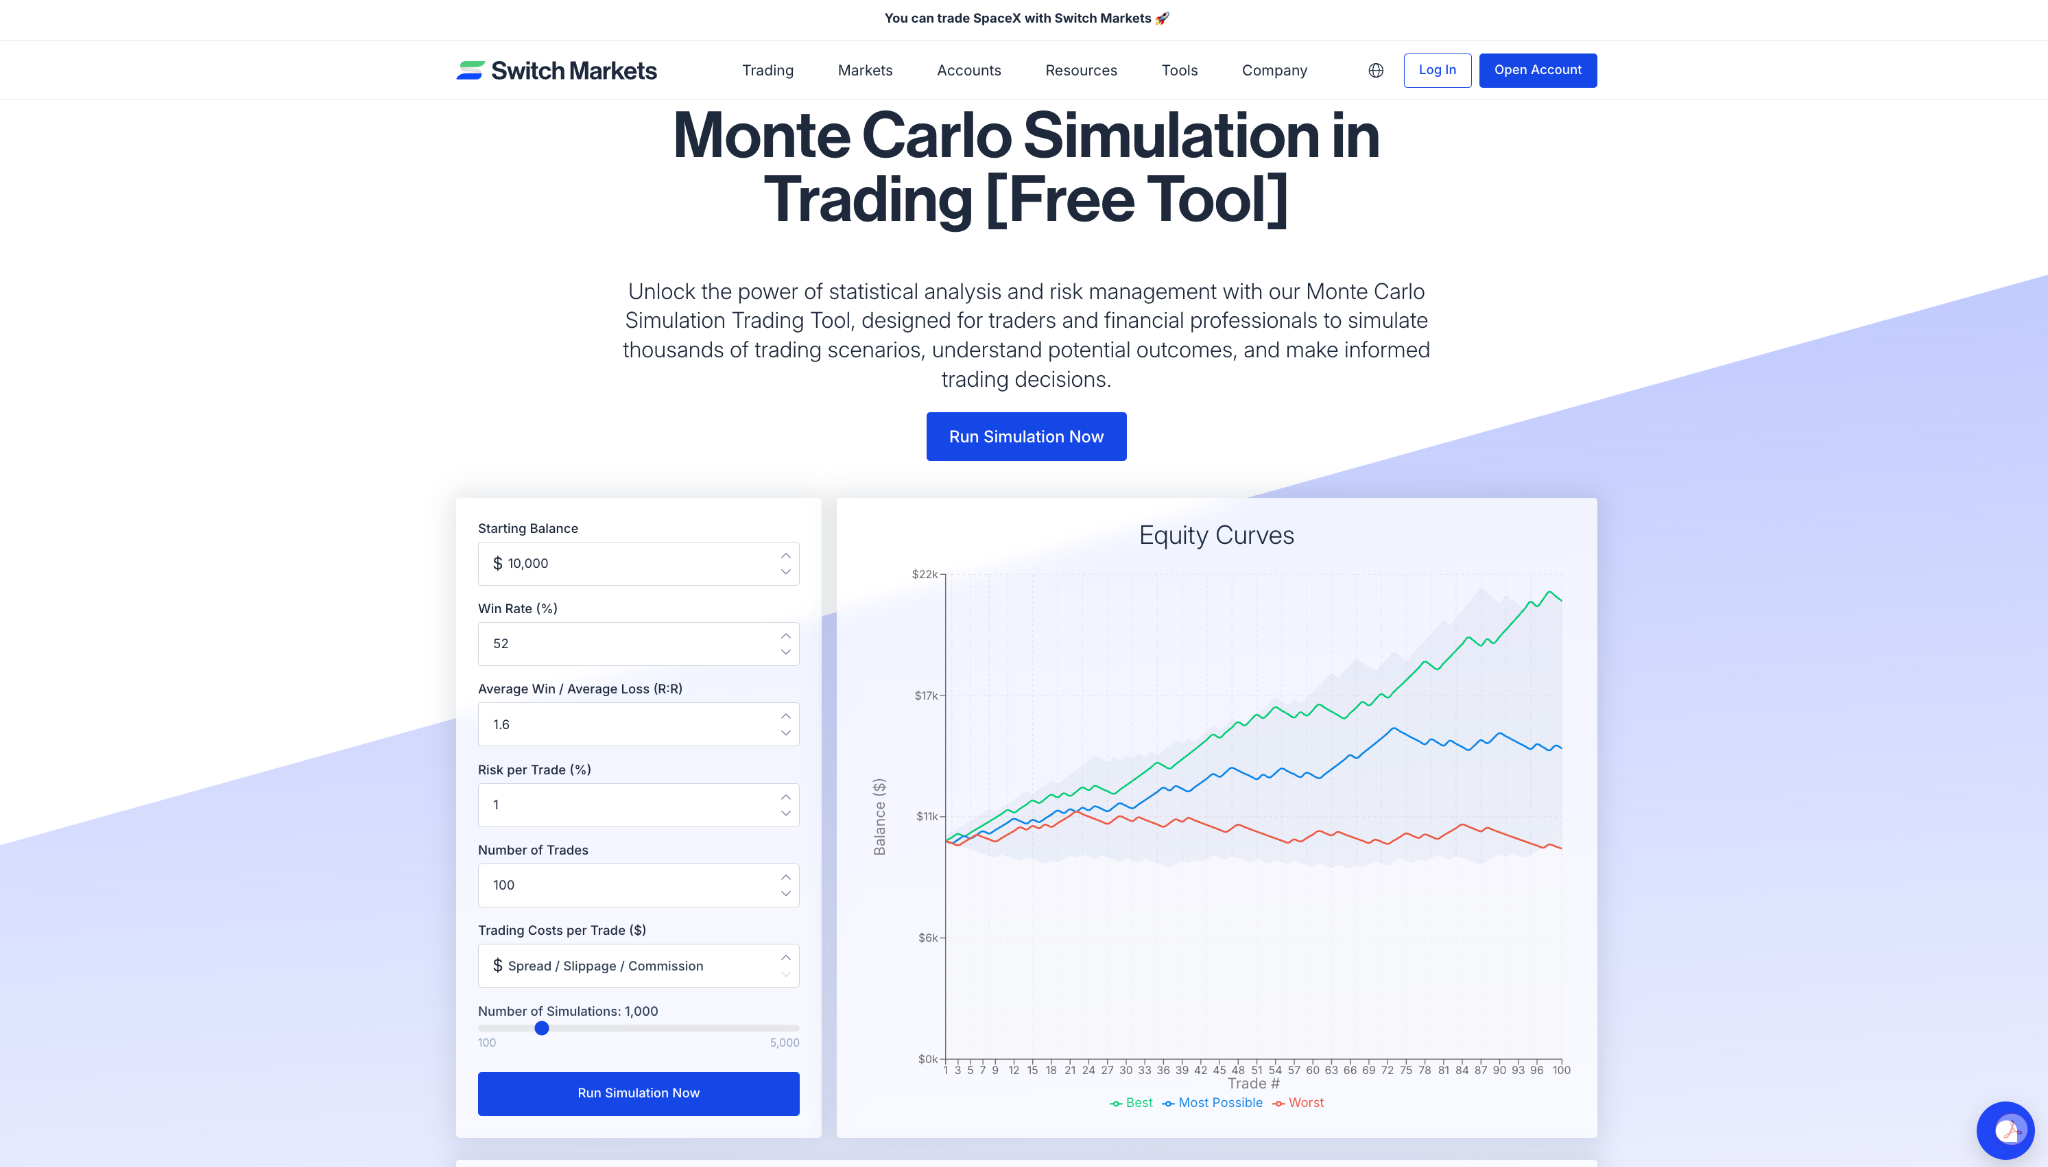
Click Run Simulation Now. The tool reshuffles your win/loss sequence across every run, rebuilds a fresh equity curve each time, and aggregates all 1,000 paths into the dashboard.
Step 3: Read the Headline Risk Metrics
Four numbers sit at the top of the results:
- Probability of Profit: The share of runs that finished above your starting balance. For this +0.35R edge over 100 trades, it landed at 99.7%.
- Probability of Ruin (50%): The chance equity fell 50% below your starting point at any stage. At 1% risk with a positive edge, it read 0.0%.
- Expectancy per Trade (R): Your average edge per trade in R. It came out at 0.35, for this example.
- Max Consecutive Losses: The longest losing streak across all 1,000 runs. This is the streak you must be ready to sit through, financially and psychologically.
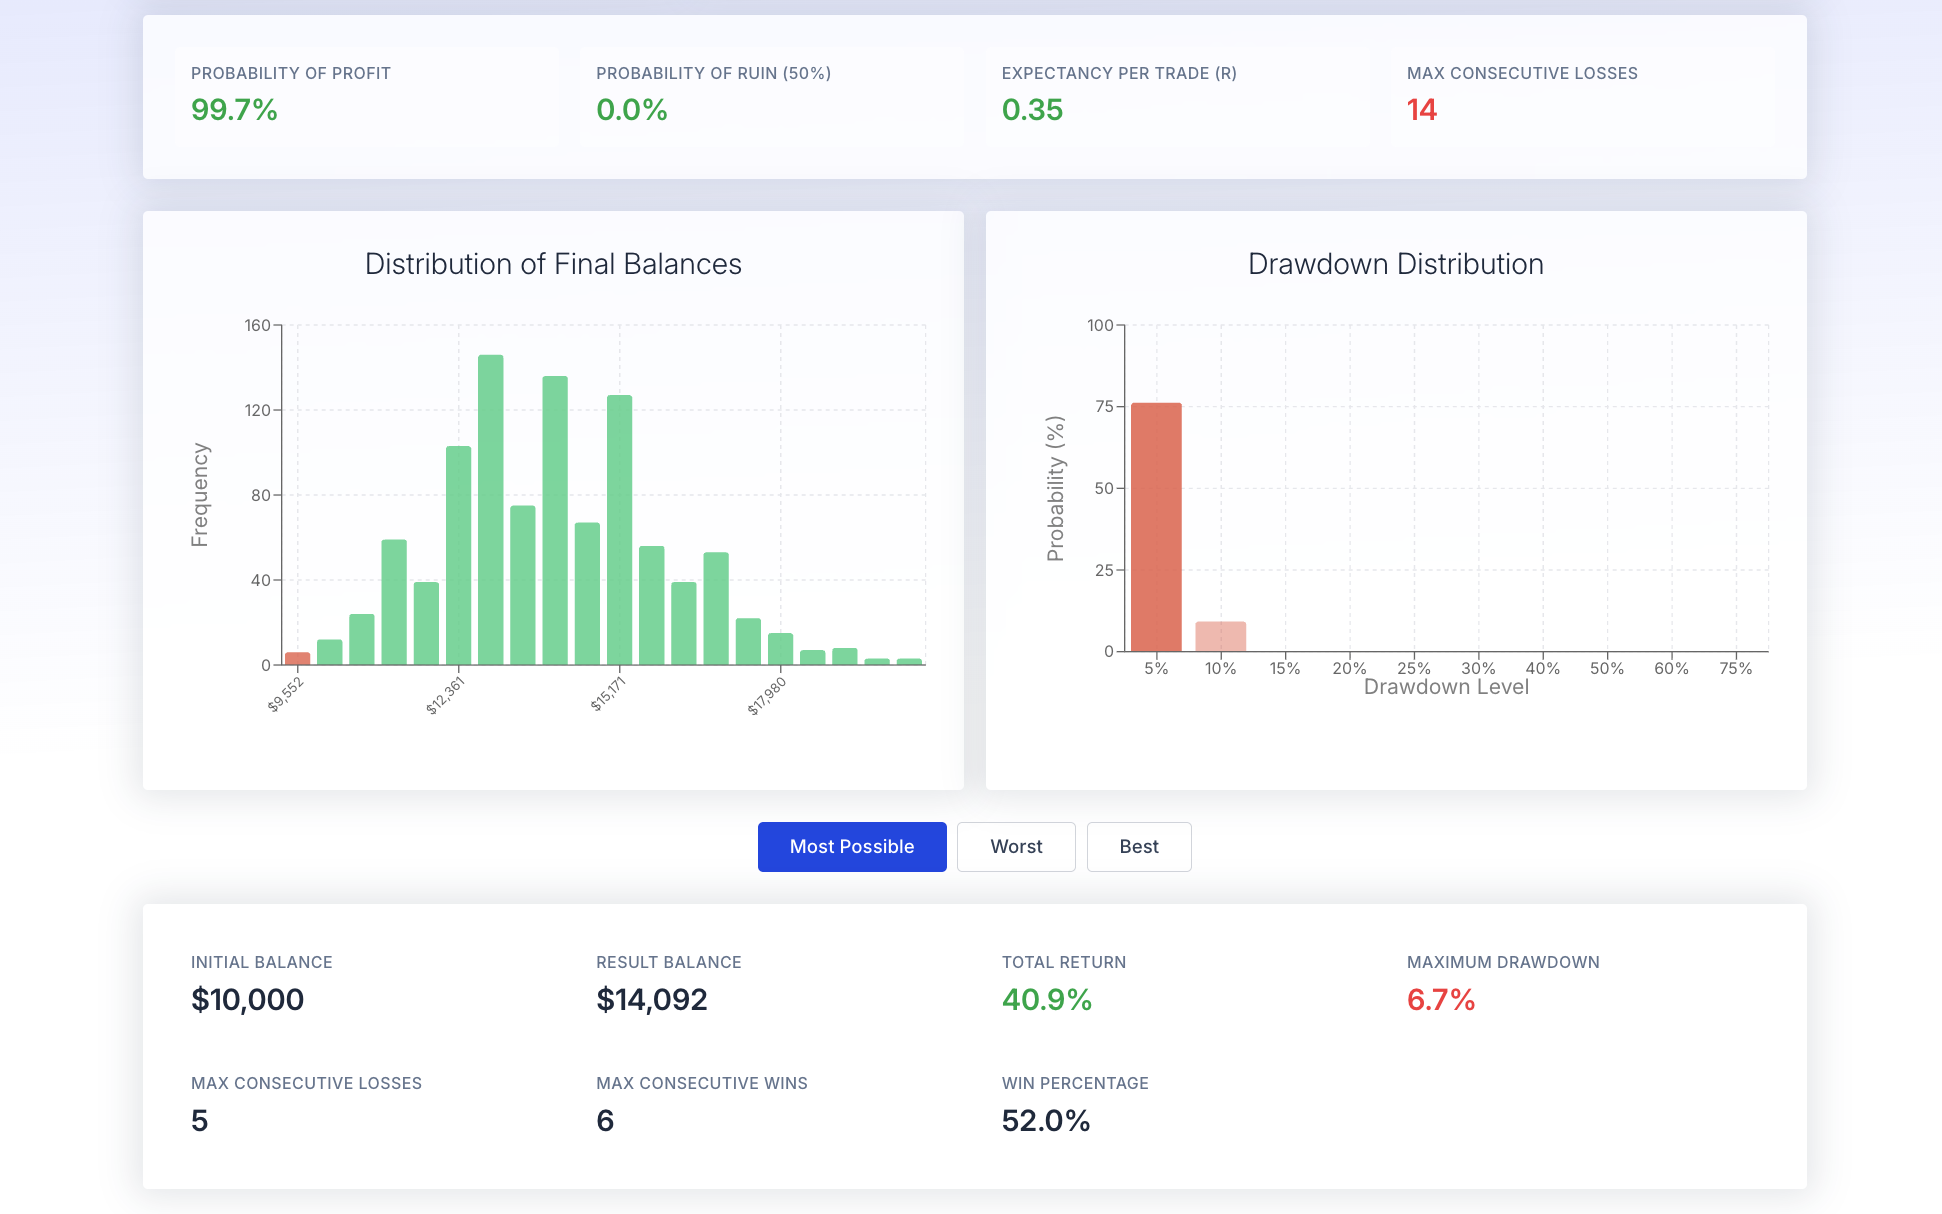
Below them, the Distribution of Final Balances histogram shows how often each ending balance occurred, and the Drawdown Distribution shows how frequently each depth of drawdown appeared.
Here the balance histogram clusters between roughly $12,000 and $15,000, and the drawdown mass sits in the 5% band.
Step 4: Adjust Risk and Rerun
Now that you’re done with the test, play around with the tool. Change one variable at a time. For instance, you can drop risk per trade from 1% to 0.5%, or raise the trade count and rerun.
You see, watching how Probability of Ruin, maximum drawdown, and the median balance respond is the whole point: it turns abstract risk into numbers you can size positions around.
Case Study: Monte Carlo on a Simple Forex Strategy (Realistic Scenario)
Let's consider a hypothetical EUR/USD intraday algorithm with these parameters from 300 historical trades (January–December 2025 backtest):
- Win rate: 52%
- Average win: 1.6R
- Average loss: 1R
- Starting balance: $10,000
- Risk per trade: 1% of equity
Expected value per trade: EV = 0.52 × 1.6R − 0.48 × 1R ≈ +0.352R. This is a mathematically profitable system under backtest assumptions.
After running 2,000 Monte Carlo simulations with resampling (250 trades per run), here are the qualitative results:
What Do These Results Mean?
This example shows how the same trading strategy can produce very different outcomes simply because the order of winning and losing trades changes. Although every simulation uses the same underlying strategy, no two equity curves are identical.
The median final balance of around $16,000–$17,000 suggests the most likely outcome after completing 250 trades. However, the 5th percentile final balance of approximately $12,000 demonstrates that there is still a realistic chance of significantly lower returns, while the 95th percentile of more than $23,000 highlights the potential for much stronger performance.
The drawdown figures are equally important. A median maximum drawdown of around 15% indicates the typical decline a trader might expect during the simulation. However, in the worst 5% of scenarios, drawdowns reach 25%–28%, showing that even a profitable strategy can experience substantial temporary losses.
Rather than predicting exactly what will happen, Monte Carlo simulation helps traders understand the range of realistic outcomes. This makes it easier to set appropriate position sizes, prepare for losing streaks, and determine whether a strategy's potential risk is acceptable before trading with real capital.
So, as you can see, Monte Carlo simulations help estimate drawdown risk and the probability of profit across these runs. Even profitable strategies can finish near breakeven or experience deep interim drawdowns in some simulated paths, despite having a strong positive expected value.
The Monte Carlo simulation shows that a trader might lower risk per trade from 2% to 1% to keep the 95th percentile maximum drawdown below −25%, accepting slightly lower median returns for significantly better survivability. Simulations reveal how strategy success is affected by variable conditions, and they help a trader determine a strategy's profitability sensitivity to trade sequences.
Using Monte Carlo Simulation in Algorithmic Trading and AI Trading
Monte Carlo simulation is a critical tool in algorithmic and AI-driven trading because it helps traders move beyond single-point backtest results and instead evaluate a full range of possible future outcomes. In real markets, even a profitable strategy can experience long losing streaks, deep drawdowns, and unpredictable sequences of trades. Monte Carlo simulation tests a strategy thousands of times with randomized trade sequences or market paths, revealing how it behaves under different conditions. This makes it far easier to identify whether a strategy is genuinely robust or simply benefited from favorable historical conditions.
For AI and algorithmic systems in particular, Monte Carlo simulation plays an important role in stress-testing model performance. Machine learning models can easily overfit historical data, producing attractive backtests that fail in live markets. By simulating thousands of variations of trade outcomes, Monte Carlo helps expose hidden weaknesses such as excessive drawdown risk, fragile win-rate assumptions, or sensitivity to trade order. This allows traders to optimize not only for returns, but for stability, survivability, and consistent performance across different market scenarios.
At Switch Markets, all clients who make a deposit also gain access to Algo Builder - an algorithmic trading builder designed to help them develop and test systematic strategies more efficiently. Combined with Monte Carlo simulation, this allows traders to evaluate strategy performance under realistic risk conditions before going live.
What Matters Most When Interpreting Monte Carlo Results
Monte Carlo simulations do not predict exact future events but show alternatives to assess risk. Here is how to translate Monte Carlo results into concrete risk management rules:
- Position sizing: Adjust position sizing to manage risk effectively. Pick risk per trade so the 95th percentile drawdown stays within your tolerance. Most trading systems perform best at 0.5–1.5% risk per trade.
- Risk of ruin thresholds: Aim for significant ruin risk below 1–5% over your simulation horizon. At 1% risk per trade, ruin probability for a positive-expectancy strategy is often below 2%; at 3%, it can exceed 20%-a significant ruin risk.
- Stop-trading triggers: If the live equity curve falls below the 5th percentile Monte Carlo band, pause and review the strategy before risking real capital further.
- Portfolio diversification: Combine uncorrelated strategies whose Monte Carlo equity curves have low overlap in worst-case scenarios.
- Periodic updates: Rerun simulations as more live trades accumulate. Future performance may differ from past performance, so treat Monte Carlo as an ongoing monitoring tool. Future results are never guaranteed by simulated results.
Common Issues When Applying Monte Carlo Simulation to Trading
Monte Carlo simulations provide a probability distribution of potential outcomes, but they are not infallible. Here are the key limitations:
- Past performance ≠ future performance: Structural breaks (2015 CHF unpeg, 2020 COVID shock, 2022–2023 inflation regimes) can invalidate historical data entirely.
- Independence assumption: Many simulations assume independent trades, but real strategies often exhibit serial correlation. Shuffling destroys this and can underestimate extreme streaks.
- Garbage in, garbage out: If the underlying backtest is curve-fitted, Monte Carlo will propagate unrealistic edge. Even a poor strategy can look profitable in an overfit backtest.
- Ignoring realistic costs: Price slippage, commissions, and latency omitted from past trades make Monte Carlo results overly optimistic versus live trading.
- Data analysis limitations: Probability distributions from simulations provide quantifiable risk management metrics, but Monte Carlo simulations estimate potential drawdowns-they don't guarantee them.
Mitigations: Use out-of-sample data, include realistic costs, test robustness under parameter variations, and combine Monte Carlo with data analysis from walk-forward testing. This is not investment advice-always validate with real capital gradually.
How to Get Started: Tools, Data, and a Simple Workflow
To get started, here's what you need to do:
- Step 1: Gather clean historical trading records from your broker, MetaTrader statements, or trading journal. Each trade should include entry date, exit date, and net P&L.
- Step 2: Compute essential inputs-win rate, average win, average loss, risk-reward ratio, and expected value-either in Excel, Python, or directly inside the SwitchMarkets Monte Carlo simulation calculator.
- Step 3: Run a baseline simulation with 1,000 iterations and 100–500 trades per run using your current risk per trade. Monte Carlo simulations help estimate maximum drawdowns and reveal potential profit and loss scenarios across all runs.
- Step 4: Experiment with different position sizes (0.5%, 1%, 2% risk) and how many trades per run to see how risk of ruin and drawdown percentiles respond.
- Step 5: Once satisfied, deploy to a stable environment such as ForexVPS, then track the live equity curve and periodically compare it to the simulated equity curve band.
- Step 6: Update quarterly or after major market events, adding recent trades to reflect changes in expected value, price movements, or volatility. Monte Carlo simulations set realistic expectations for drawdowns-use them continuously, not just once.
In sum, when used correctly, Monte Carlo simulation is a powerful tool that helps traders make more informed decisions by understanding risk, preparing for different market scenarios, and setting realistic expectations. It should not be viewed as a way to predict future results, but rather as a framework for improving strategy validation, risk management, and long-term trading discipline. If you have a strategy in mind that you would like to test, or an algorithmic trading method you want to apply, you should certainly backtest on a Monte Carlo simulator.
FAQ
Does Monte Carlo simulation predict exactly how my equity curve will look?
No. Monte Carlo does not forecast one precise future. It generates a probability distribution of many possible equity curves based on your inputs. Your real live equity curve is just one path that should statistically fall somewhere within the simulated range. Deviations outside the bands can signal genuine market changes, execution issues, or broker behavior worth investigating. These simulations introduce randomness to backtesting to understand various outcomes, not to provide a crystal ball.
Can I use Monte Carlo methods if I only have a small number of trades?
Monte Carlo with fewer than about 100–150 trades is possible but produces much higher uncertainty and wider confidence intervals. Treat results as exploratory, supplement with synthetic scenarios, and focus on conservative risk per trade. Continue updating the simulation as more historical trades accumulate-reliability improves meaningfully beyond 200–300 trades.
How should I choose between trade-based and price-path Monte Carlo simulations?
Trade-based Monte Carlo uses your actual P&L per trade and is usually better for system-level evaluation of trading systems. Price-path simulation generates synthetic price movements from historical volatility and drift-more common for options, complex portfolios, or path-dependent payoffs. Most retail FX and CFD traders should start with trade-based Monte Carlo using their historical trades.
How often should I rerun Monte Carlo on my strategy?
Rerun simulations whenever there is a significant change: new market regime, major parameter update, or after every few hundred new trades. For slower swing or position strategies, a quarterly review is sufficient. Treat Monte Carlo as an ongoing data analysis and risk analysis tool, not a one-time pre-launch check. Simulations reveal how strategy success is affected by variable conditions over time.
Is Monte Carlo useful if I'm already using machine learning and advanced backtests?
Absolutely. Monte Carlo complements machine learning pipelines rather than replacing them. Even sophisticated models benefit from Monte Carlo stress tests to understand path dependency, drawdown analysis, and probability of ruin under varied trade sequences. Combining robust ML models, Monte Carlo risk mapping, and reliable live infrastructure like ForexVPS gives the best chance of aligning real-world trading results with quantitative expectations. Remember: no model eliminates randomness entirely, and this content is not investment advice.
Risk Disclosure: The information provided in this article is not intended to give financial advice, recommend investments, guarantee profits, or shield you from losses. Our content is only for informational purposes and to help you understand the risks and complexity of these markets by providing objective analysis. Before trading, carefully consider your experience, financial goals, and risk tolerance. Trading involves significant potential for financial loss and isn't suitable for everyone.