8 Must-Know Chart Patterns for Beginner Traders
Chart patterns are the closest thing traders have to a shared language. Once you learn how to read chart patterns, the market stops feeling random and starts feeling negotiable.
Used alongside candlestick patterns and a few well-chosen technical indicators, they form the backbone of technical analysis and help you predict market movements with far more confidence than gut feel.
This guide is a bit different from the chart pattern cheatsheets you’ve seen. You won’t just learn what each pattern looks like.
You’ll also learn when each one works best, the technical indicators that pair well with it, and how to structure a trade around it. That’s the part most beginner guides skip, and it’s also the part that separates pattern-spotters from pattern-traders.
Ready to get into it? Read on.
What Are Chart Patterns?
A chart pattern is a recognizable shape that an asset’s price draws on a price chart over time. It forms because traders keep reacting to the same zones, the same news flows, and the same emotions. Fear and greed leave fingerprints. Those fingerprints are chart patterns.
Traders group the most common chart patterns into three broad categories:
- Reversal patterns signal that the prevailing trend is losing steam and the market may soon move in the opposite direction. Double tops, head and shoulders, and rising wedges all fall here. These are the formations that most often precede trend reversals.
- Continuation patterns suggest the current trend is only pausing for breath before resuming in the same direction. Flags, pennants, and cup and handle formations are textbook continuation patterns.
- Bilateral patterns can break either way. The symmetrical triangle is the classic example. You wait for a breakout, then trade the direction the price chooses.
Once you can mentally sort any of the different chart patterns on your screen into one of these three buckets, everything else is detail.
How to Read Chart Patterns Like a Trader
Before we dive into the patterns themselves, let’s standardize your reading process. Each time a pattern forms on your screen, run through these four checks:
- Identify the prevailing trend. Is the market in an uptrend, downtrend, or sideways range? Patterns read differently depending on context. For instance, a bullish continuation pattern in a downtrend is not bullish; it’s more likely a bear flag.
- Map the key structure. Find the support and resistance levels, the trend line, and the points where price has bounced off (touches) these lines. A pattern usually needs at least two or three clean touches to count.
- Wait for the breakout. A pattern is only valid once price breaks the pattern’s decisive line (e.g., neckline, trend line, or horizontal resistance). Until then, you have a setup, not a signal.
- Confirm with volume and indicators. A breakout on thin volume often fails. A breakout backed by a surge in volume, a supportive momentum reading, technical indicators, or confluence with a key moving average has far better odds.
Skip any of these steps, and you’re guessing. Follow all four, and you’re trading.
The 8 Must-Know Chart Patterns for Beginner Traders
Here are the eight formations every beginner should burn into memory.
It’s important to know that no chart pattern works 100% of the time. Your edge comes from trading patterns in the right context and from solid risk management when they fail. With that said, let’s learn some chart patterns.
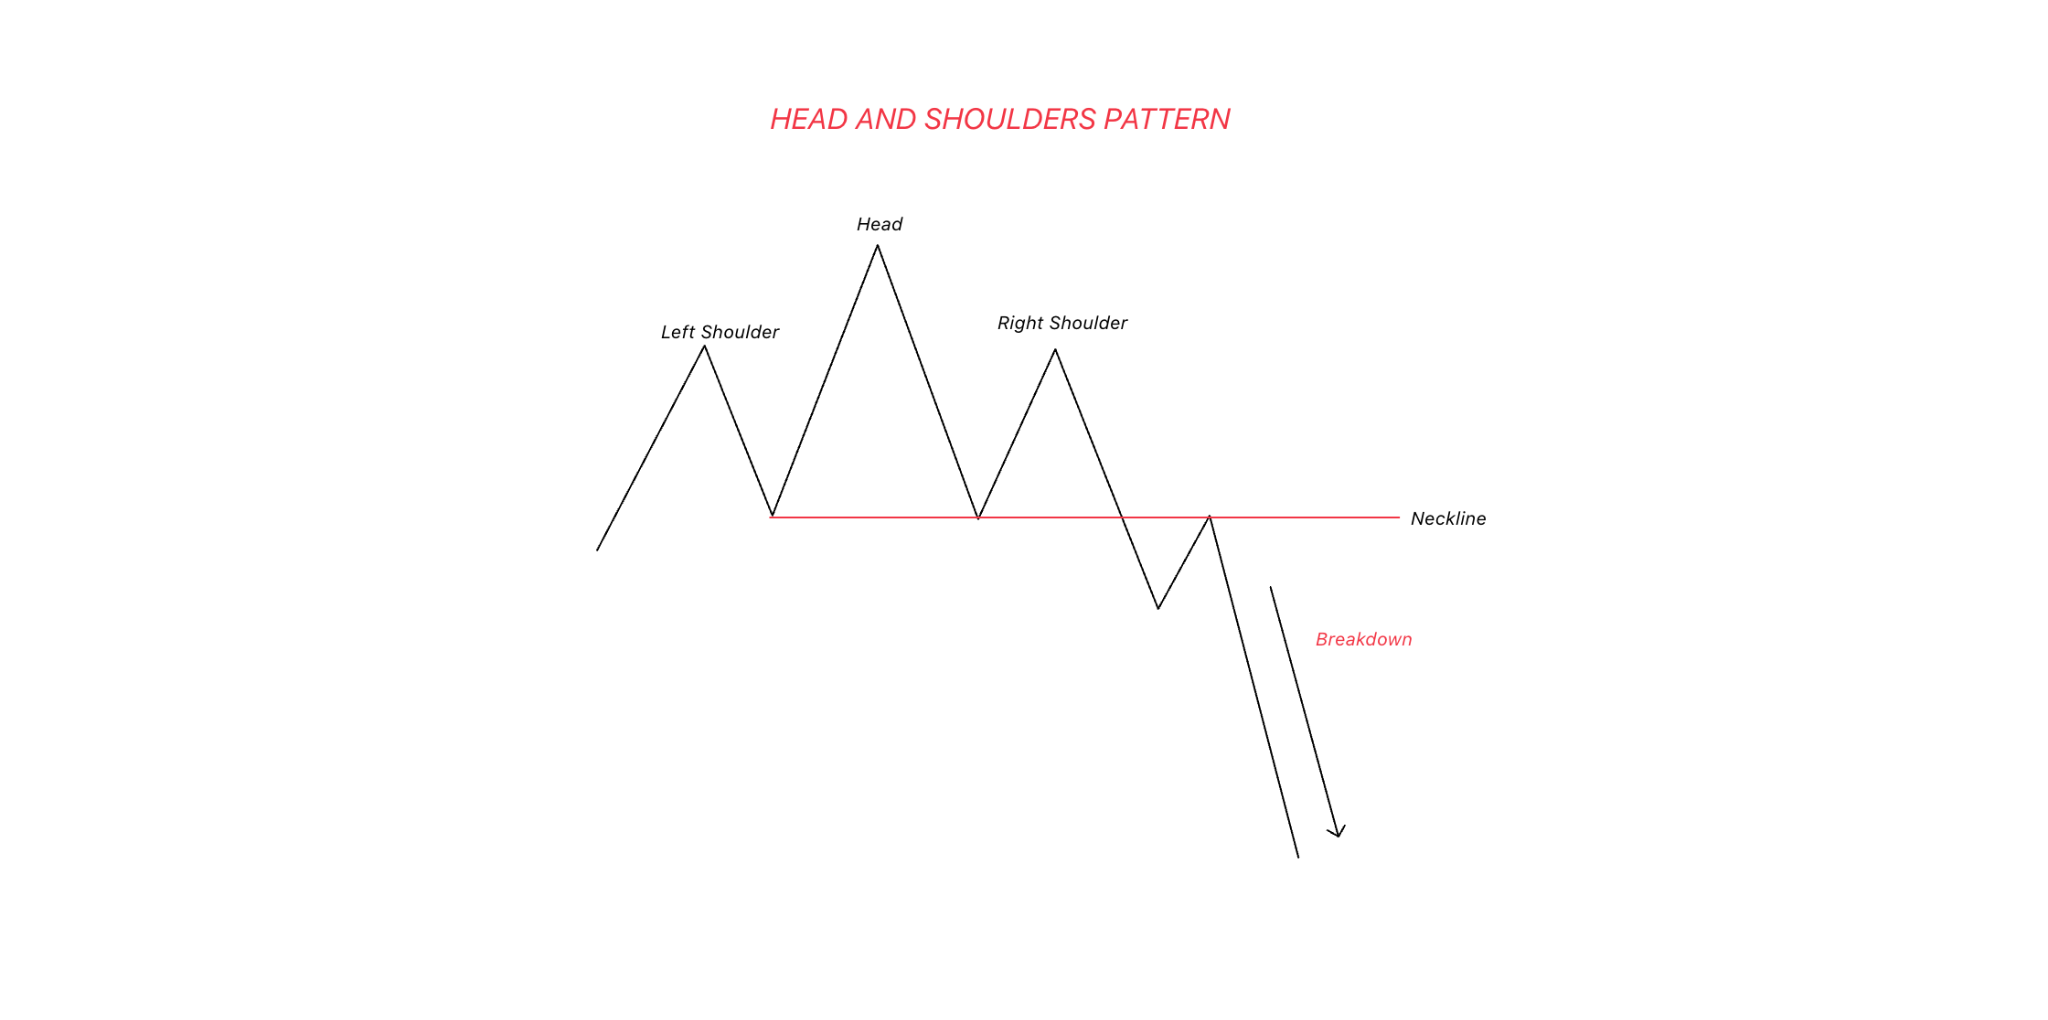
1. Head and Shoulders Pattern (Bearish Reversal)
What It Is
The head and shoulders is one of the most reliable reversal patterns in technical analysis. It forms at the end of an uptrend and signals that buyers are losing control.
The shape is self-descriptive: three peaks, with the middle peak (the head) taller than the two on either side, which are the shoulders. A roughly horizontal support line, called the neckline, connects the two troughs between the peaks.
How It Forms
After a strong uptrend, the price prints a new high (the left shoulder), pulls back, rallies to an even higher high (the head), then pulls back again. The third rally fails to match the head and forms a lower peak (the right shoulder). When the price finally breaks below the neckline, the uptrend is considered over.
Works Best When
- The pattern develops at the end of a long, clean uptrend rather than inside a choppy range. This context turns it into a high-probability signal of a possible trend reversal.
- The left shoulder, head, and right shoulder (the third peak, lower than the second) are roughly symmetrical in height and time on either side of the head.
- The neckline is broken on a decisive candle close, not just a quick wick.
Best Indicators to Pair With It
- Volume: Volume should be highest during the left shoulder, slightly lower at the head, and visibly weaker on the right shoulder. This divergence is the pattern’s fingerprint.
- RSI: A bearish divergence between the head and the right shoulder on the Relative Strength Index is a powerful confirmation.
- Moving Averages: A break of the 50- or 200-period moving average shortly after the neckline break adds conviction.
How to Trade It
- Entry: Short on a confirmed close below the neckline, or on the retest from below.
- Stop loss: Just above the right shoulder.
- Take profit: Measure the vertical distance from the head to the neckline, then project that distance downward from the breakout point.
Flip this bearish pattern upside down, and you have the inverse head and shoulders, which is a bullish reversal that forms at the end of a downtrend and often marks the start of a new bullish market. The trading logic is identical, just in the opposite direction.
2. Double Top and Double Bottom (Reversal)
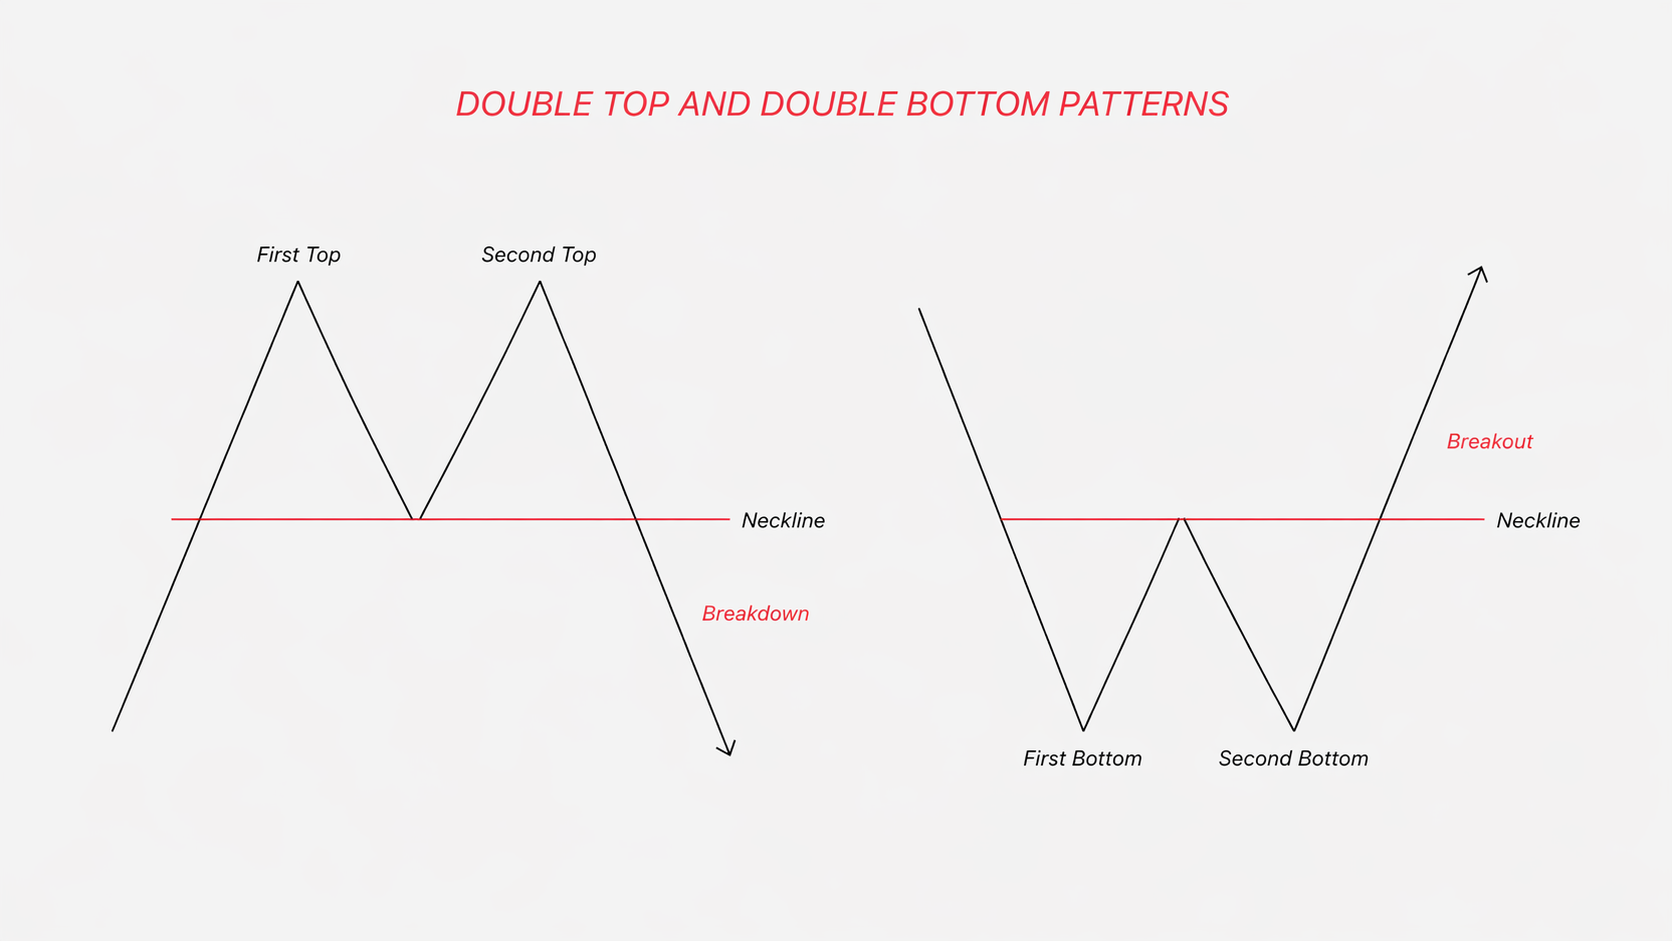
What It Is
The double top is a bearish reversal pattern that forms at the end of an uptrend when the price tests the same resistance line twice and fails to break through. The double bottom is a bullish reversal that forms at the end of a downtrend when the price tests the same support level twice and holds.
How It Forms
- Double top pattern: Price rallies to a high, pulls back, then rallies back to the same high but cannot push past it. When price breaks below the pullback low (the neckline) the bearish reversal is confirmed.
- Double bottom pattern: Price falls to a low, bounces, then falls back to retest that low but holds. When price breaks above the intervening peak, the bullish reversal is confirmed.
Works Best When
- The two peaks (or troughs) form at almost the same price level.
- There’s a clear pullback of at least 10–15% between the two touches.
- The pattern forms after an extended trend, not in the middle of a choppy range.
Best Indicators to Pair With It
- RSI or MACD divergence: Bearish divergence at the second peak, or bullish divergence at the second trough, is often the earliest warning that the trend is exhausted.
- Volume: Lower volume on the second peak compared to the first suggests weakening conviction.
- Support and resistance zones: The neckline often aligns with a historical horizontal line. The more historical confluence, the stronger the signal.
How to Trade It
- Entry: On the neckline break or the retest.
- Stop loss: Just above the double top, or just below the double bottom.
- Take profit: Measure the height between the peaks (or troughs) and the neckline, and project that distance in the direction of the breakout.
3. Cup and Handle Pattern (Bullish Continuation)
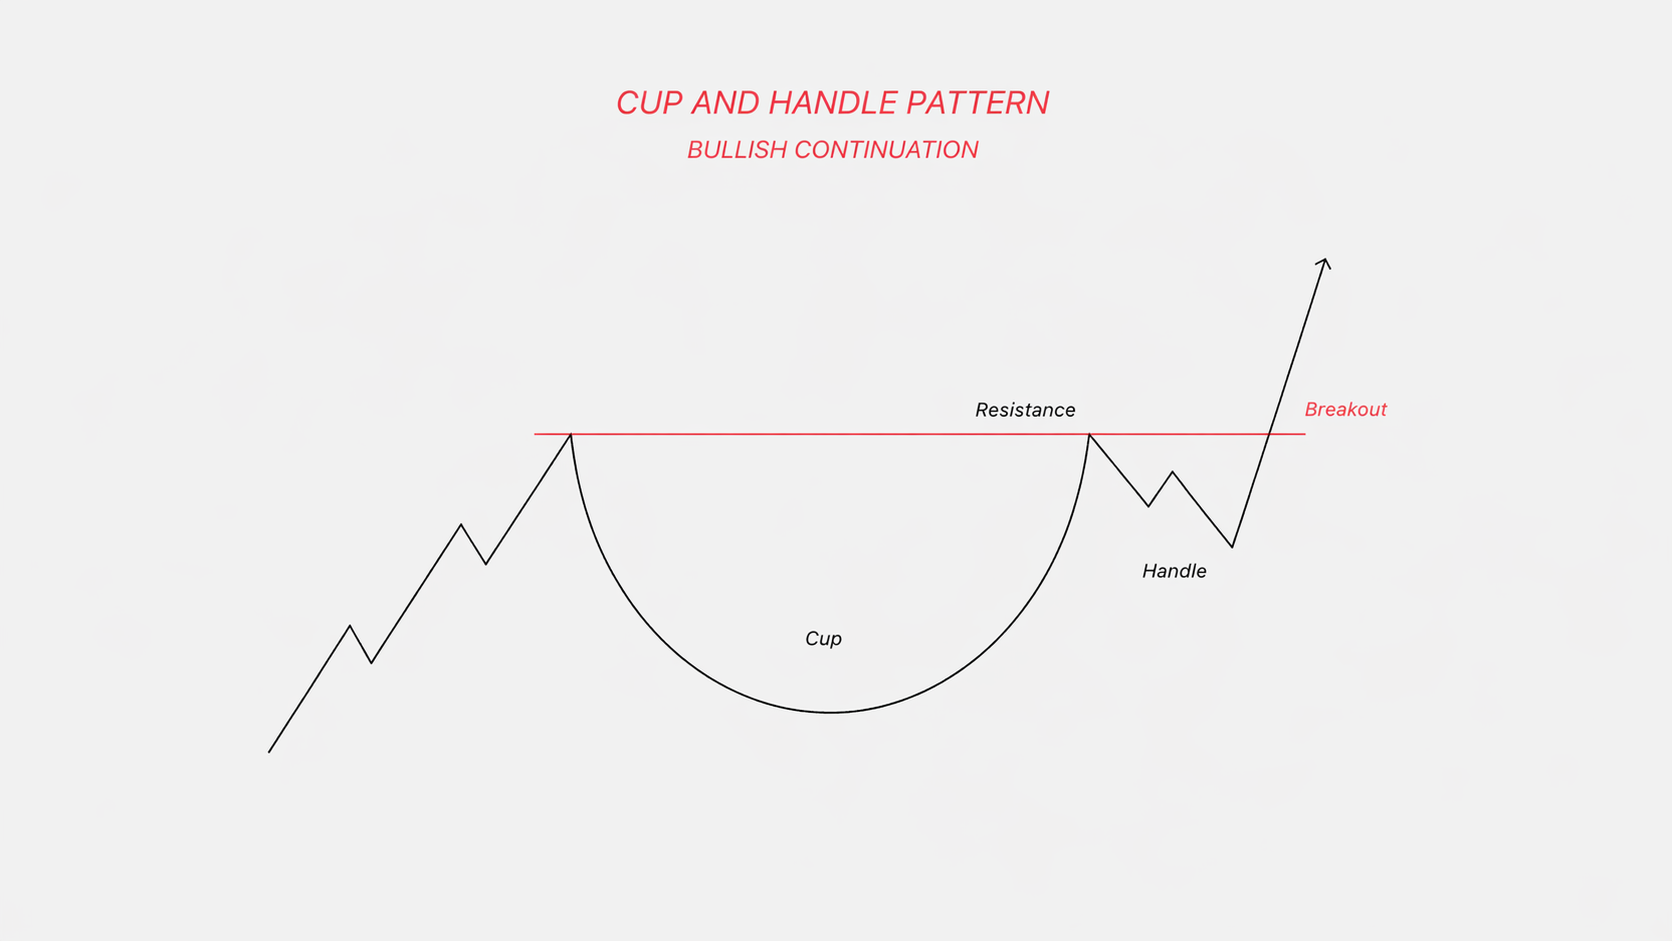
What It Is
The cup and handle, popularized by William O’Neil, is a bullish continuation pattern that shows up after an existing uptrend. It takes the form of a rounded "U" (the cup) followed by a shallow pullback that forms the handle.
When price breaks out above the handle’s resistance line, the prior uptrend typically resumes with force.
How It Forms
After an uptrend, the price drifts lower in a gentle, rounded decline, then slowly grinds its way back up toward the previous high. This is the cup, and it should look more like a saucer than a sharp "V". At the top of the cup, price consolidates in a tight, slightly downward-drifting channel (the handle) before breaking out.
Works Best When
- The cup is deep enough to flush out impatient holders, but not so deep that it resembles a reversal pattern.
- The handle is shallow, usually retracing no more than 30–50% of the cup, and forms in the upper half of the cup.
- The breakout is backed by a surge in volume.
Best Indicators to Pair With It
- Volume: Volume should dry up during the cup and handle, then expand sharply on the breakout.
- Moving Averages: The 50-period moving average often acts as dynamic support throughout the formation.
- RSI: A reading above 50 on the breakout confirms bullish momentum.
How to Trade It
- Entry: On the breakout above the handle’s upper boundary.
- Stop loss: Below the low of the handle.
- Take profit: Measure the depth of the cup and project it upward from the breakout point.
4. Ascending Triangle Pattern (Bullish Continuation)
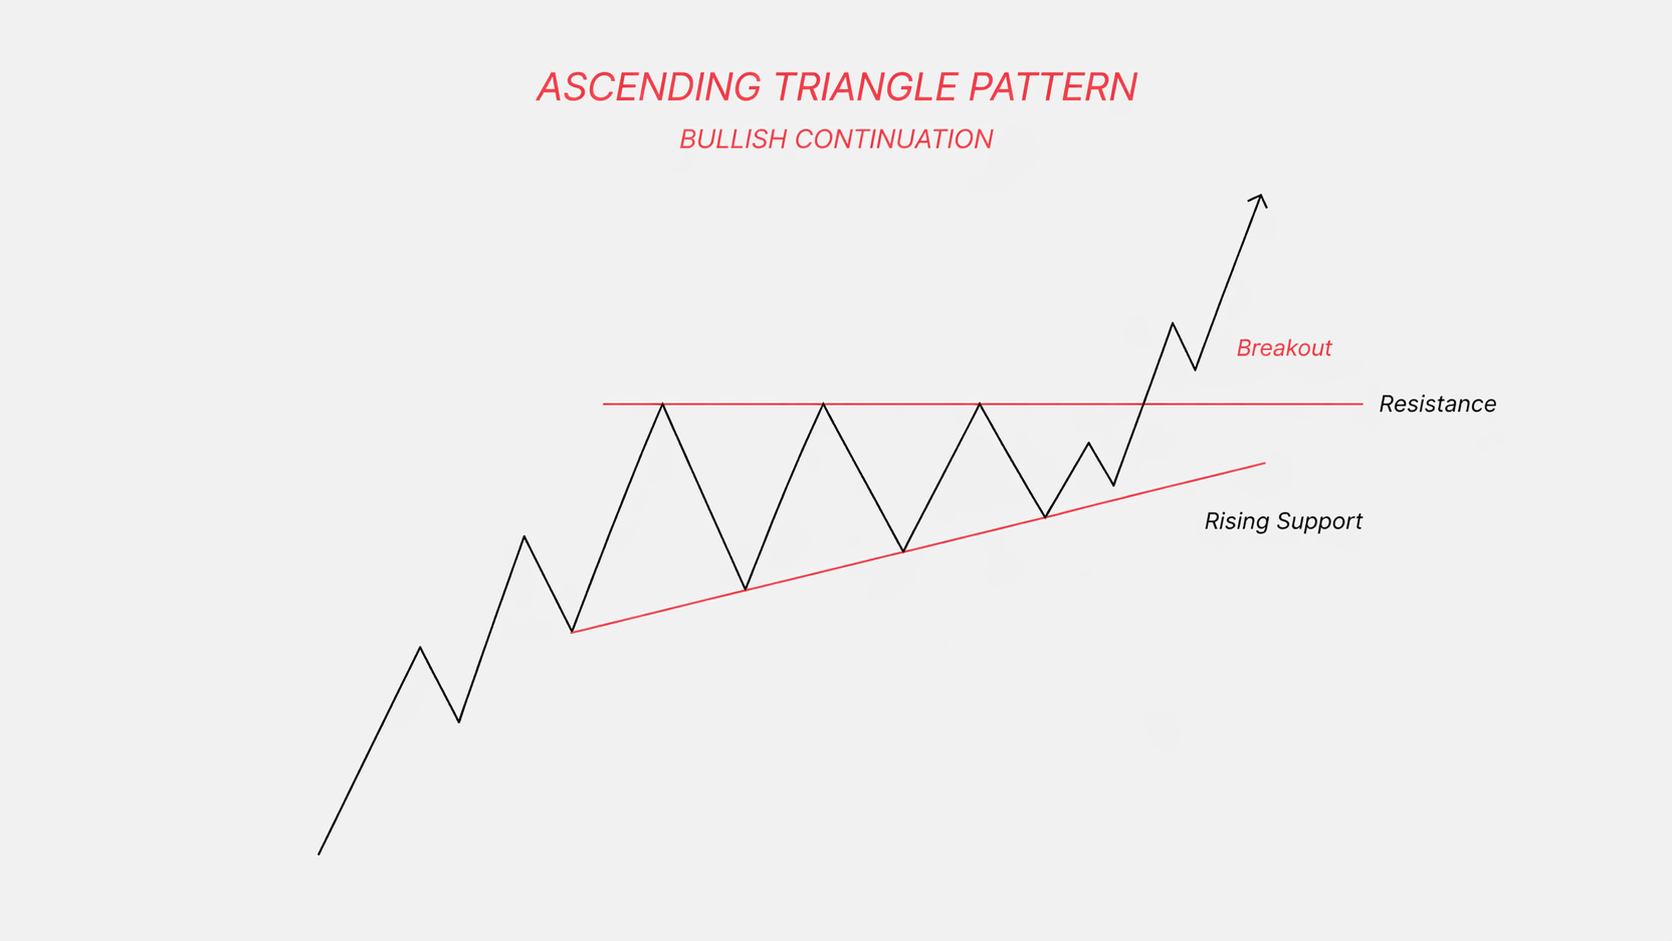
What It Is
The ascending triangle pattern forms when price makes a series of higher lows while repeatedly testing a flat, horizontal resistance line.
The two converging trend lines create a triangle shape that slopes upward, signaling that buyers are growing increasingly aggressive while sellers defend a fixed level. When the resistance line finally breaks, the uptrend typically continues with conviction.
How It Forms
Each rally hits the same horizontal resistance line. Each pullback is shallower than the last. Over time, the rising trend line of higher lows squeezes price against the resistance line until one side gives.
Works Best When
- The pattern appears within an ongoing uptrend. It is, after all, a continuation pattern.
- There are at least two clean touches on the horizontal resistance line and two on the rising trend line.
- Volume contracts as the triangle tightens, then expands on the breakout.
Best Indicators to Pair With It
- Volume: Declining volume during the formation, expanding volume on the breakout.
- Bollinger Bands: Bands tightening around price as the triangle forms signal a volatility squeeze, which is often followed by an explosive move.
- MACD: A bullish MACD crossover near the breakout adds weight to the signal.
How to Trade It
- Entry: On a confirmed close above the horizontal resistance.
- Stop loss: Below the last higher low inside the triangle.
- Take profit: Measure the triangle’s widest height and project it upward from the breakout point.
5. Descending Triangle Pattern (Bearish Continuation)
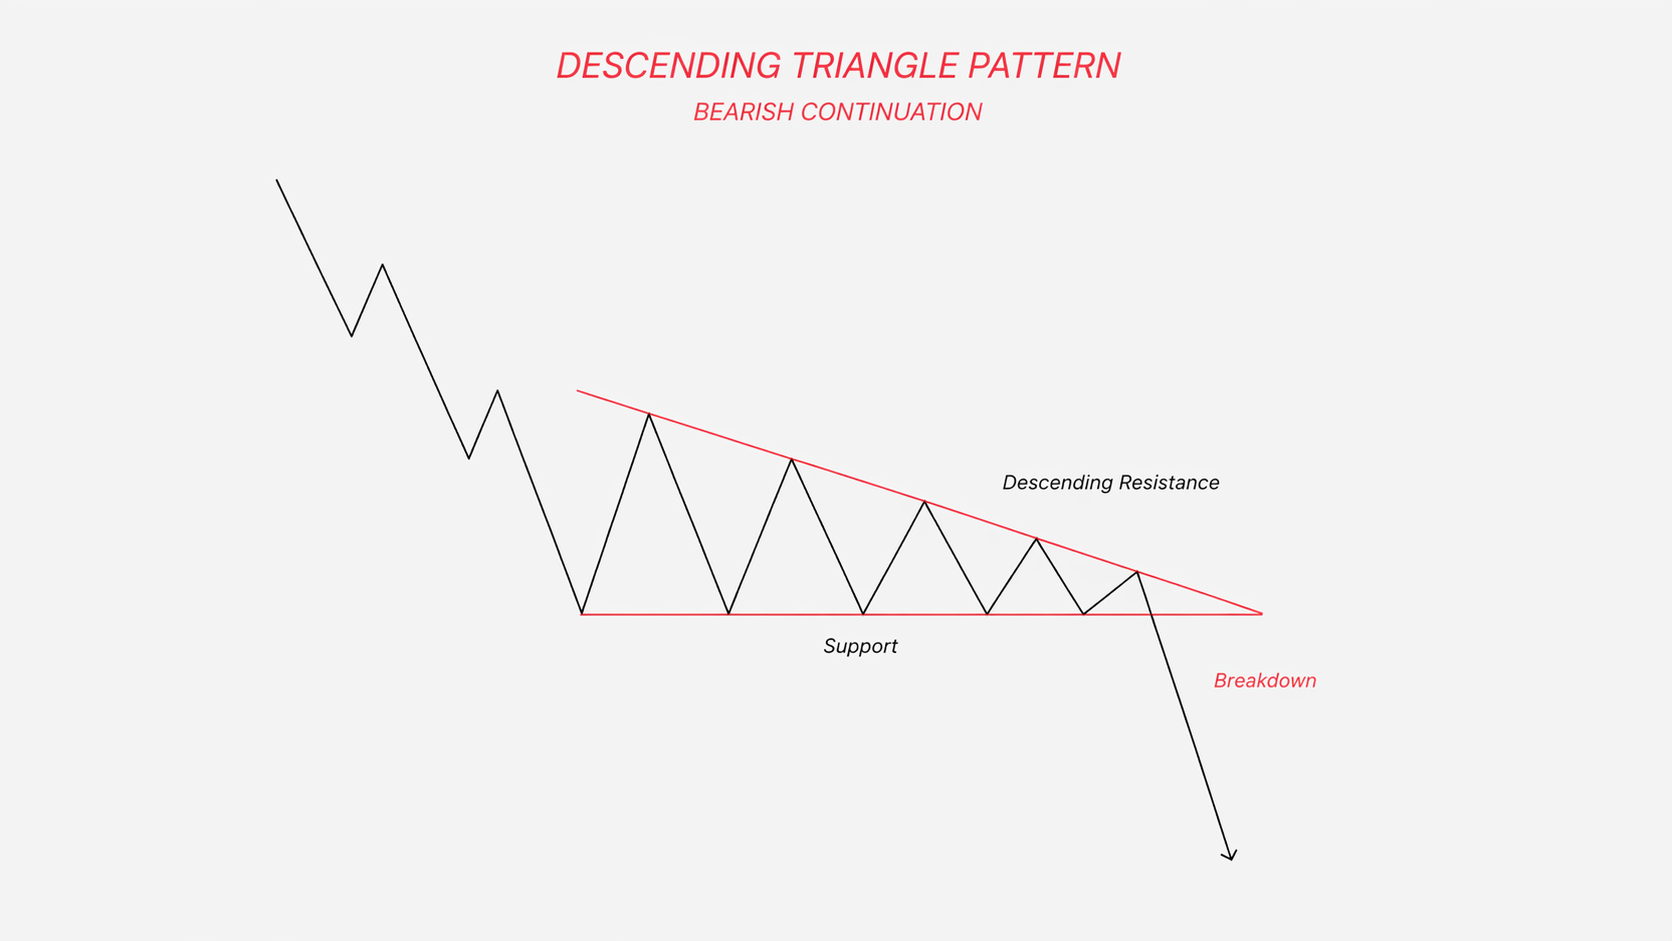
What It Is
The descending triangle pattern is the ascending triangle flipped on its head. It forms when price makes a series of lower highs while repeatedly testing a flat horizontal support line. The result is a triangle sloping downward, revealing mounting selling pressure against a fixed buyer zone. When the support line finally breaks, the downward trend typically resumes.
How It Forms
Each bounce off support reaches a lower high than the last. Each pullback revisits the same support zone. Sellers are tightening the screws while buyers defend the same floor until the floor gives way.
Works Best When
- The pattern appears within an existing downtrend.
- There are at least two clean touches on the flat horizontal support and two on the descending trend line.
- Volume expands as the support line breaks.
Best Indicators to Pair With It
- Volume: A volume spike on the support break confirms the selling pressure is genuine.
- RSI: A reading below 50 reinforces bearish momentum.
- Moving Averages: Price trading below its 50- and 200-period moving averages reinforces the bearish bias.
How to Trade It
- Entry: On a confirmed close below the horizontal support.
- Stop loss: Above the last lower high inside the triangle.
- Take profit: Measure the triangle’s widest height and project it downward from the breakdown point.
6. Symmetrical Triangle Pattern (Bilateral)
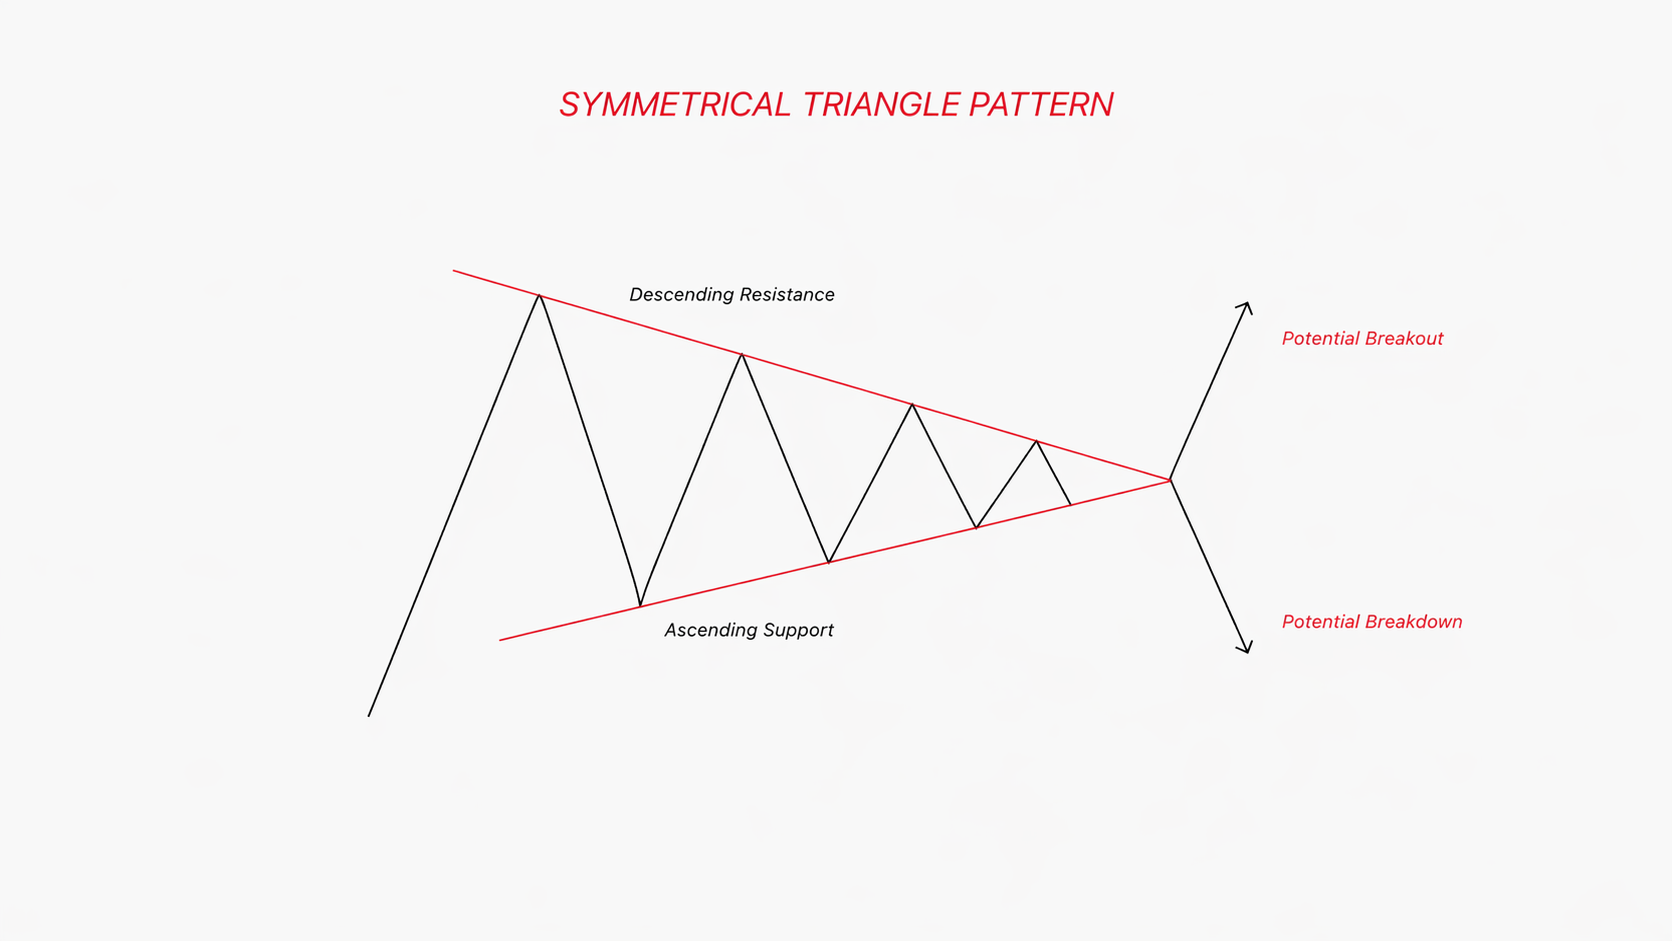
What It Is
The symmetrical triangle is the most neutral of the three triangles. It forms when price makes lower highs and higher lows at the same time, squeezing into the apex of a triangle. Neither bulls nor bears have the upper hand. The market is winding up like a spring, and the breakout can go either way.
How It Forms
Each rally prints a lower high. Each dip prints a higher low. Price carves out a converging triangle shape, typically over 10 to 30 bars. Volatility contracts. Eventually, one side wins, and the price breaks out decisively.
Works Best When
- The pattern forms in the middle of a strong existing trend. More often than not, it resolves as a continuation rather than a reversal.
- The breakout comes with a strong candle close and a clear surge in volume.
- Price has at least two clean touches on each trend line.
Best Indicators to Pair With It
- ATR (Average True Range): A falling ATR confirms the volatility squeeze inside the triangle. A sudden ATR expansion marks the breakout.
- Volume: Volume should dry up inside the triangle and spike on the breakout.
- Bollinger Bands: Bollinger Bands narrowing to historic tightness often precede symmetrical triangle breakouts.
How to Trade It
- Entry: On the break of either trend line, confirmed by a strong candle close and volume expansion.
- Stop loss: Just beyond the opposite trend line.
- Take profit: Measure the triangle’s widest height and project it in the direction of the breakout.
7. Flag Pattern (Continuation)
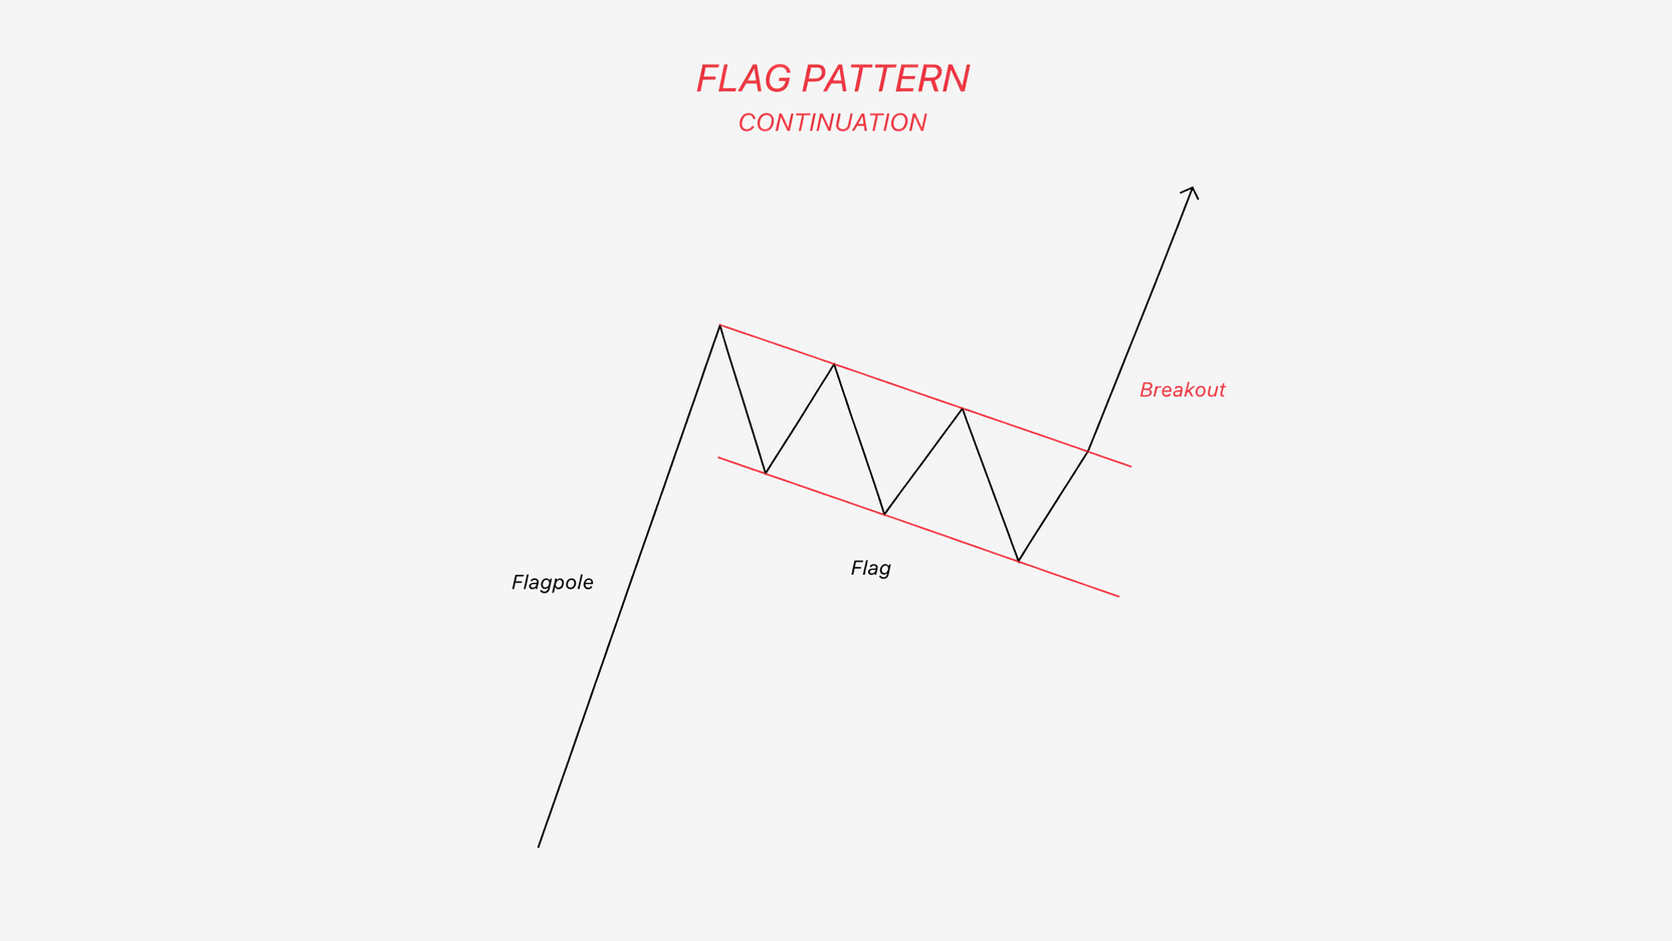
What It Is
The flag pattern is the simplest, fastest, and one of the most reliable continuation patterns in all of technical analysis. It forms after a sharp, near-vertical price move (the flagpole) followed by a brief, tightly bound pullback that forms the flag. When price breaks out of the flag in the same direction as the pole, the original move typically resumes.
How It Forms
Price makes a powerful directional move (up or down), then consolidates in a narrow parallel channel that slopes gently against the prior trend.
A bull flag slopes slightly down inside an uptrend; a bear flag slopes slightly up inside a downtrend.
Works Best When
- The flagpole is strong and recent, not a stale move from days ago.
- The consolidation is tight and lasts only a handful of bars, typically five to fifteen.
- The breakout occurs in the same direction as the flagpole.
Best Indicators to Pair With It
- Volume: High volume on the flagpole, low volume inside the flag, and expanding volume on the breakout.
- Moving Averages: A short-term moving average, such as the 20 EMA, often acts as dynamic support during a bull flag consolidation.
- RSI: Should remain in bullish territory (above 50) during a bull flag. The opposite applies for a bear flag.
How to Trade It
- Entry: On the break of the flag’s upper (or lower) boundary.
- Stop loss: On the opposite side of the flag channel.
- Take profit: Measure the length of the flagpole and project it from the breakout point.
8. Rising and Falling Wedges (Reversal)
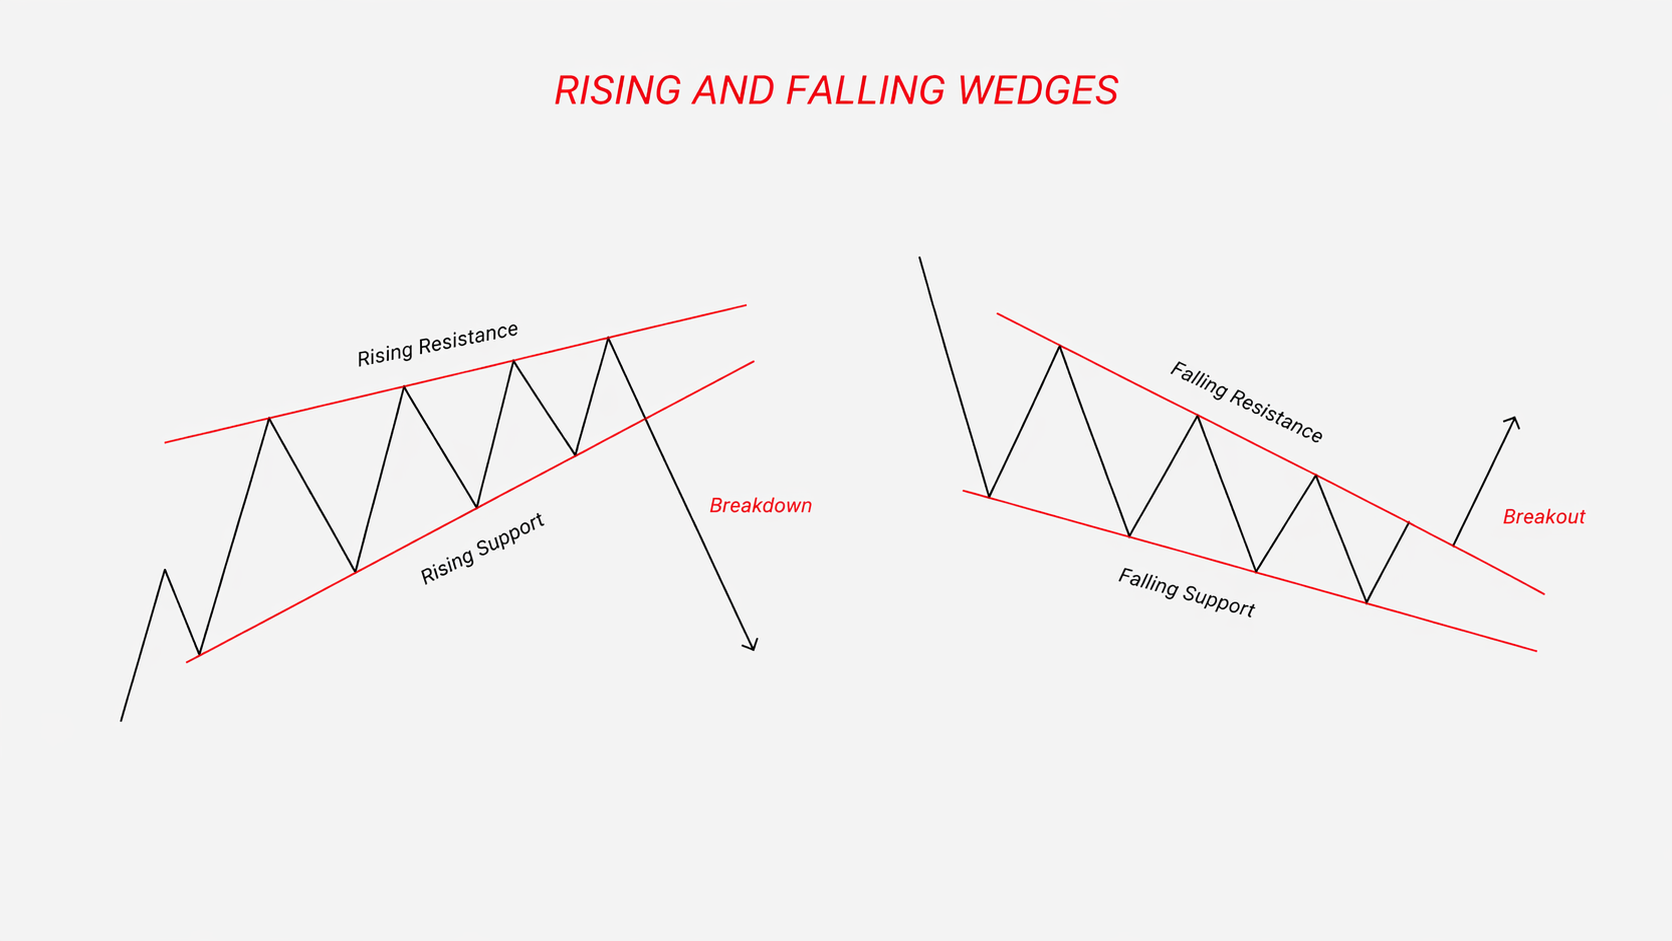
What It Is
The wedge pattern is built from converging trend lines that slope in the same direction, which is what separates it from a triangle pattern, where one line is flat, or the two lines converge symmetrically.
A rising wedge has both trend lines sloping up, but the upper line rises more slowly than the lower line. That is a bearish reversal pattern that signals a weakening uptrend.
A falling wedge has both lines sloping down, with the lower line falling more slowly than the upper. That is a bullish reversal pattern that signals a weakening downward trend.
How It Forms
- Rising wedge: Higher highs and higher lows, but the new highs grow increasingly reluctant. Buyers are running out of breath. When the lower trend line breaks, the bearish reversal is confirmed.
- Falling wedge: appears when Lower lows and lower highs, but the new lows grow shallower. Sellers are exhausted. When the upper trend line breaks, the bullish reversal is confirmed.
Works Best When
- The wedge forms at the end of an extended move, not in the middle of a consolidation.
- There are at least three touches on each trend line.
- The breakout is confirmed by expanding volume and a clean candle close.
Best Indicators to Pair With It
- RSI Divergence: Bearish divergence on a rising wedge, or bullish divergence on a falling wedge, is one of the strongest confirmations you will find on any chart pattern.
- Volume: Volume typically declines as the wedge tightens, then expands on the reversal breakout.
- Stochastic Oscillator: Overbought readings on a rising wedge, or oversold readings on a falling wedge, reinforce the setup.
How to Trade It
- Entry: On the break of the wedge’s trend line in the direction of the reversal.
- Stop loss: Just beyond the opposite trend line.
- Take profit: Measure the widest part of the wedge and project it from the breakout point.
Chart Patterns in Practice
Reading about chart patterns every trader should know is one thing. Trading them live is another. Beginners typically go through three phases:
- Recognition: You learn to spot patterns — often after the fact, looking at historical charts.
- Real-time identification: You start spotting patterns as they develop. You’ll see false positives. You’ll miss real ones. That’s normal.
- Execution: You build the discipline to wait for confirmation, size your position correctly, and manage the trade after entry.
A few rules that will shorten your learning curve and sharpen your market analysis:
- Trade patterns with the broader market context, not against it. A bull flag in a raging bear market is a lower-probability trade than a bull flag inside an ongoing trend to the upside. Context decides which of the bullish patterns deserve your capital and which don’t.
- Combine chart patterns with at least one confirming indicator, and ideally with candlestick patterns too. Price action tells you what. Indicators and candles tell you how confident you should be.
- Be cautious in volatile markets. Wide candles and fast reversals can invalidate clean setups in seconds. Consider waiting for a retest of the breakout level before entering when volatility is elevated.
- Size positions so that no single failed pattern can damage your account. Even the cleanest setups fail. Risk management and solid trading strategies are what keep you in the game long enough to get good.
- Practice in a demo account first. Switch Markets offers a non-expiring demo account, which is perfect for building pattern-recognition skills without risking real capital.
- Document every pattern trade you take. Our free trading journal template lets you log the pattern, the indicators you used, your entry, stop, and outcome. Over 50–100 trades, you’ll see which of the best chart patterns suit your personal style.
At Switch Markets, we believe the path from beginner to consistent trader is paved with structured practice, not shortcuts. Patterns are one piece of that structure - a powerful piece, but only a piece.
Wrapping Up
In sum, chart patterns don’t predict the future. They describe the back-and-forth between buyers and sellers, mapped visually onto a price chart.
Learn to read the eight patterns in this guide, and you’ll be able to interpret most setups the market throws at you:
- Reversal patterns: head and shoulders, double top and double bottom, and rising and falling wedges.
- Continuation patterns: cup and handle, ascending triangle, descending triangle, and flag pattern.
- Bilateral pattern: the symmetrical triangle.
Start by focusing on two or three patterns that suit your style, pair them with the indicators that feel natural to you, and practice on a demo account until recognition is second nature. Then (and only then) put real money on the line.
Trade smart, trade patiently, and let the patterns come to you.
FAQs
Here are some quick answers to the most common things beginner traders ask about chart patterns.
What is the most reliable chart pattern for beginners?
There is no single "most reliable" chart pattern as reliability varies by market, timeframe, and broader market context. That said, head and shoulders, double tops and double bottoms, and flags are widely considered the most beginner-friendly, because their shapes are easy to identify and their trade rules are well-defined.
How long does it take to master chart patterns?
Expect one to three months of consistent chart study and demo trading before you can spot patterns early and trade them consistently. Most beginners plateau because they jump between patterns too quickly. Focus on two or three formations until you can identify them instinctively.
What is the best timeframe for trading chart patterns?
It depends on your trading style. Day traders typically trade patterns on the 5-minute to 1-hour charts. Swing traders work on the 4-hour and daily charts. The higher the timeframe, the more reliable the pattern, but also the fewer the setups.
Do chart patterns work on forex as well as stocks?
Yes. Chart patterns work across all liquid markets (forex, stocks, indices, commodities, and crypto) because they reflect universal trader psychology rather than asset-specific behavior.
The same head and shoulders you see on EURUSD can form on gold, oil, or any major stock index. Forex patterns, stock chart patterns, and crypto chart patterns all follow the same underlying logic.
Risk Disclosure: The information provided in this article is not intended to give financial advice, recommend investments, guarantee profits, or shield you from losses. Our content is only for informational purposes and to help you understand the risks and complexity of these markets by providing objective analysis. Before trading, carefully consider your experience, financial goals, and risk tolerance. Trading involves significant potential for financial loss and isn't suitable for everyone.