Trading Journal: How to Use It and What to Track (With Free Template)
- Free Trading Journal Template
- What Is a Trading Journal? (Simple Definition)
- Why Keeping a Trading Journal Matters
- Core Data to Track: Execution, P&L, and Risk
- Recording Market Conditions and Trade Setup
- Logging Emotional State and Behavior
- What Should You Monitor and Learn From Your Trading Journal?
- Using a Free Trading Journal Template (Switch Markets)
- Weekly and Monthly Review: Turning Data Into Improvement
- Paper Trading vs. Live Trading: Journaling Both
- Digital, Spreadsheet, or Software: Where to Keep Your Journal?
- Final Word
- FAQ
Most traders spend hours studying charts, testing indicators, and refining entries, but never systematically record what they actually did and why. A trading journal changes that. It turns scattered trades into measurable data you can learn from, week after week.
This guide walks you through what a trading journal is, what to track, how to review your data, and how to download a free template to get started today.
Key Takeaways
Free Trading Journal Template
Want to improve your trading discipline and track your progress? Switch Markets offers a free downloadable trading journal template to help you record your trades, monitor performance, identify patterns, and learn from both winning and losing trades. Download it for free and take a more structured approach to your trading.
Download Our Free Trading Journal Template Now
What Is a Trading Journal? (Simple Definition)
A trading journal is a structured record of every trade you take, showing what you traded, why you took it, how you managed risk, and what the outcome and lessons were. It captures both quantitative and qualitative data-numbers like P&L alongside notes about your reasoning and mindset. From my personal experience, I can tell you it is widely used by professional traders and is one of the first tools provided by prop firms.
This is different from the account history inside your trading platforms. Your broker's trade history shows fills, timestamps, and raw P&L. A proper journal adds the layers that matter: your setup reasoning, emotional state, market conditions, and whether you followed your trading plan.
Here is a concrete example. Say you take a EURUSD day trade on 16 November 2026. You enter long at 1.0825, set a stop loss at 1.0805 (20-pip risk, 1R), and target 1.0865. The trade hits target for a +2R result. Your journal entry captures the date, direction, entry price, exit price, R multiple, setup tag ("London pullback"), and a note: "Calm entry, followed plan, H4 trend was bullish."
A trading journal can be a notebook, a spreadsheet in Google Sheets, or dedicated trading journal software. What matters is the quality and consistency of the entries, not necessarily the format.
Both discretionary and algorithmic traders benefit. Discretionary traders use it to track psychology and decision-making. EA traders use it to verify whether live execution matches their backtests-a gap that research shows can be surprisingly large due to slippage, latency, and data feed differences.
Why Keeping a Trading Journal Matters
Human memory is unreliable for trading. You remember the dramatic wins and the painful blowups, but forget the many small losing trades that quietly erode your account. This leads to an inaccurate view of your trading performance-and bad decisions based on feelings instead of facts.
And this is why a trading journal is such a valuable tool. A trading journal is a structured feedback system for traders. It provides objective data on win rate, average R per trade, profit factor, and net P&L so you can decide whether your strategy truly has a positive expectancy or whether you are gradually bleeding capital.
Journaling also exposes habits you would never notice otherwise. A journal helps identify costly trading habits like overtrading on Fridays, revenge trading after a losing streak, trading on tilt, or skipping a great setup because of recent fear. Consistent logging reduces confirmation bias and enhances accuracy in trade reviews-you see what actually happened, not what you think happened.
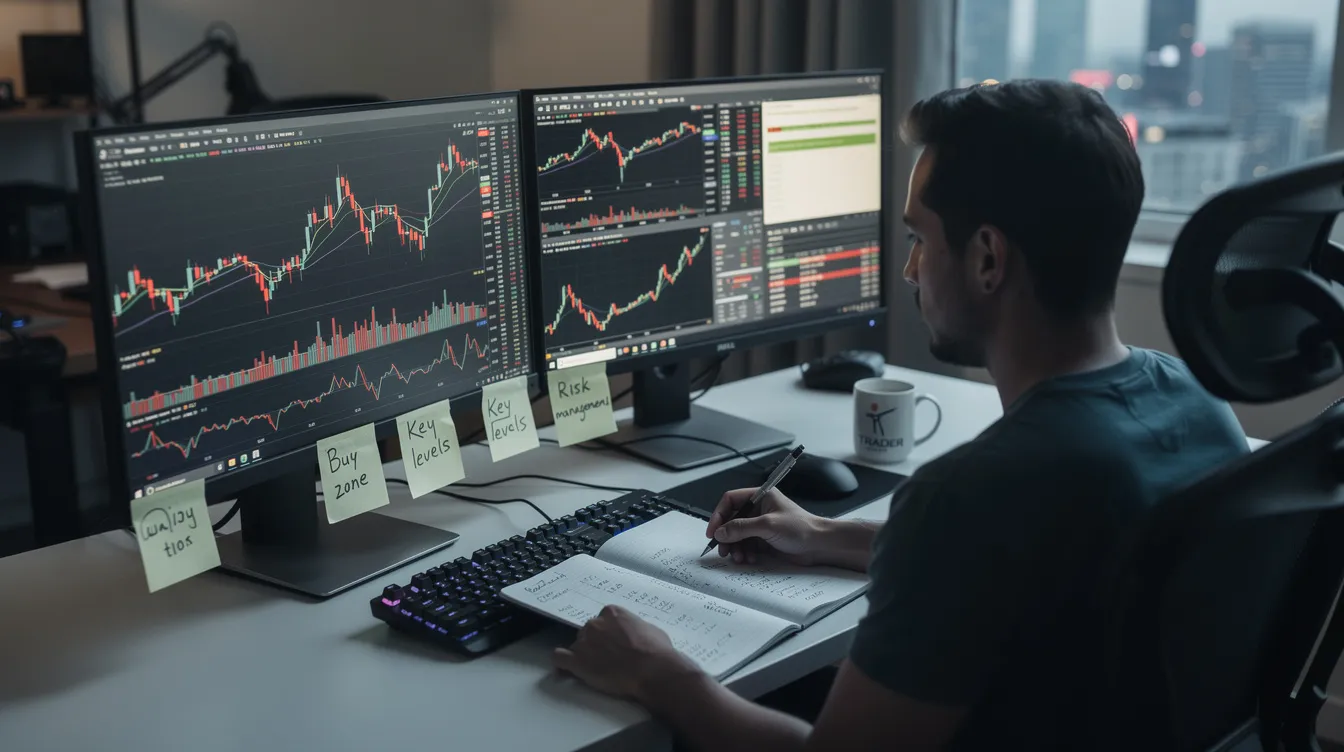
Here is a practical example. After 50 journal entries, a trader discovers that London-session EURUSD pullbacks return an average of +1.8R, while late US-session breakout trades return −0.5R. Without the journal, both setups "felt" roughly equal. With data, the path forward is obvious: trade more of what works, cut what does not.
Prop firms and professional traders expect you to "know your numbers." A structured journal is the simplest way to answer questions about drawdowns, expectancy, and plan adherence. It keeps traders accountable for their decisions and adherence to strategies, which is exactly what evaluators and risk managers look for.
Core Data to Track: Execution, P&L, and Risk
This is the quantitative backbone of your journal. These fields should be filled out for every single trade, no exceptions.
Basic execution fields:
Essential data in trading includes entry and exit prices, position size, and risk. Track entry, stop loss, exit, and position size for every trade without exception.
P&L metrics:
- Gross P&L in your account currency
- Fees, commission, and spread costs
- Net P&L (gross minus costs)
Many traders overestimate performance by ignoring commissions. Over a few weeks of active day trading, those costs add up and can turn a marginal edge negative.
Risk metrics and R multiples:
- Risk per trade in currency (e.g., $50 risk)
- R multiple for each trade (e.g., −1R loss, +2.5R win)
- Risk-to-reward ratio, which compares potential profit to potential loss per trade
Calculate results in R multiples for comparability. A +2R win on a 0.1-lot trade and a +2R win on a 1.0-lot trade represent the same quality of execution relative to risk, even though the dollar amounts differ.
Measurable performance metrics include win rate (the percentage of winning trades), average win, average loss, and profit factor (gross profit divided by gross loss). Trading expectancy calculates the average expected profit or loss per trade-it combines win rate with average win and average loss to tell you whether your edge is real. Maximum drawdown indicates the largest decline from peak portfolio value.
A study of approximately 5,000 trading accounts found that traders who journaled consistently had a profit factor of 1.42 compared to 0.91 for non-journalers, and average max drawdowns of 4.1% versus 8.9%.
In the Switch Markets free trading journal template, these numbers can be set up to auto-calculate so you are not wasting time on manual math.
Recording Market Conditions and Trade Setup
Clearly, tracking your performance is the most valuable metric you can get. However, you also want to track what's behind the trades you take. So, identical entries can have very different odds depending on market conditions. A EURUSD long in a tight Asian range behaves nothing like the same entry during a high-volatility US CPI release. Context matters.
Contextual fields to add:
- Higher-timeframe trend (up, down, range)
- Volatility level (ATR reading, or simple "low/normal / high")
- Important support and resistance zones near your entry
- Active news or economic events on that date
Record market conditions like trend and volatility for every trade. This is what turns a flat log into actionable insights about when your trading strategy actually works.
Tag each trade with a clear setup tag-one primary label per trade chosen from a consistent list of 3–8 names. Examples: "London breakout," "NY session pullback," "Asian range fade," "news spike reversal," "trend continuation." Keep the taxonomy tight so you can filter later.
Over 30–100 journal entries, patterns emerge. These tags reveal which setups deliver the best trading results and which ones consistently lead to losing trades or low-quality P&L. A trading journal can reveal which strategies work best under specific conditions-trending markets, high volatility days, or quiet sessions.
Attach or link chart screenshots from your trading platform. If you run MT4 or MT5, taking a quick screenshot of the chart at entry and exit takes seconds and makes visual review during weekly sessions far more effective.
Logging Emotional State and Behavior
Traders often underestimate how strongly emotional state influences execution and risk decisions. Emotional trading-whether driven by fear, greed, boredom, or overconfidence-is behind many of the worst losses in financial markets.
Log your emotional state before and after each trade. Use a simple scale (1–5) or fixed keywords like "calm," "neutral," "anxious," "overconfident," or "rushed." Keep it fast-this should take five seconds, not five minutes.
Add 1–2 short fields for during-trade and post-trade behavior:
- "Moved stop because I was afraid to lose"
- "Hesitated and entered late due to fear of missing out"
- "Felt a revenge urge after a previous loss"
Recording emotional state can highlight how trading psychology affects trading decisions. Emotional tracking in a journal identifies recurring psychological patterns-things you would never spot from P&L alone.
After 50–100 trades, tracking emotions reveals patterns affecting trade performance. You might find that your win rate drops significantly when you trade tired after work, or that your P&L improves when you skip a day after a major drawdown. These are patterns that emerge that no chart indicator can show you.
Emotional notes become especially valuable for traders running many trades per day or using high leverage, where small lapses in discipline can quickly compound into large losses.
What Should You Monitor and Learn From Your Trading Journal?
A trading journal is not just a log-it is a feedback loop that helps refine trading rules and habits over time. Effective trading journals consider execution quality, not just profits or losses.
Add a simple "Followed plan? Y/N" column. This single field separates system losses (you followed the plan, the trade just lost) from trader errors (you broke a rule). Over time, this distinction is one of the most important metrics in your journal.
Track rule violations explicitly. Common ones include:
- Oversized position
- No stop-loss set
- Traded outside your designated session
- Ignored scheduled news events
- Added to a losing trade
- Decided to exit early out of fear
Include a lesson learned for each trade-one concise, actionable takeaway. Not "be more patient" (too vague) but "Do not trade against H4 trend even if M5 shows a clean pattern" or "Scaling out early cut potential profit from 3R to 1R." Documenting lessons learned enhances future trading decisions and future trading strategies.
Weekly or monthly reviews of these lessons help you prioritize which behavior changes to implement first-such as enforcing a daily limit on trades to prevent revenge trading.
Tracking risk management through these process fields helps protect trading capital over the long run. A journal keeps you honest about whether losses came from the market or from you.
Using a Free Trading Journal Template (Switch Markets)
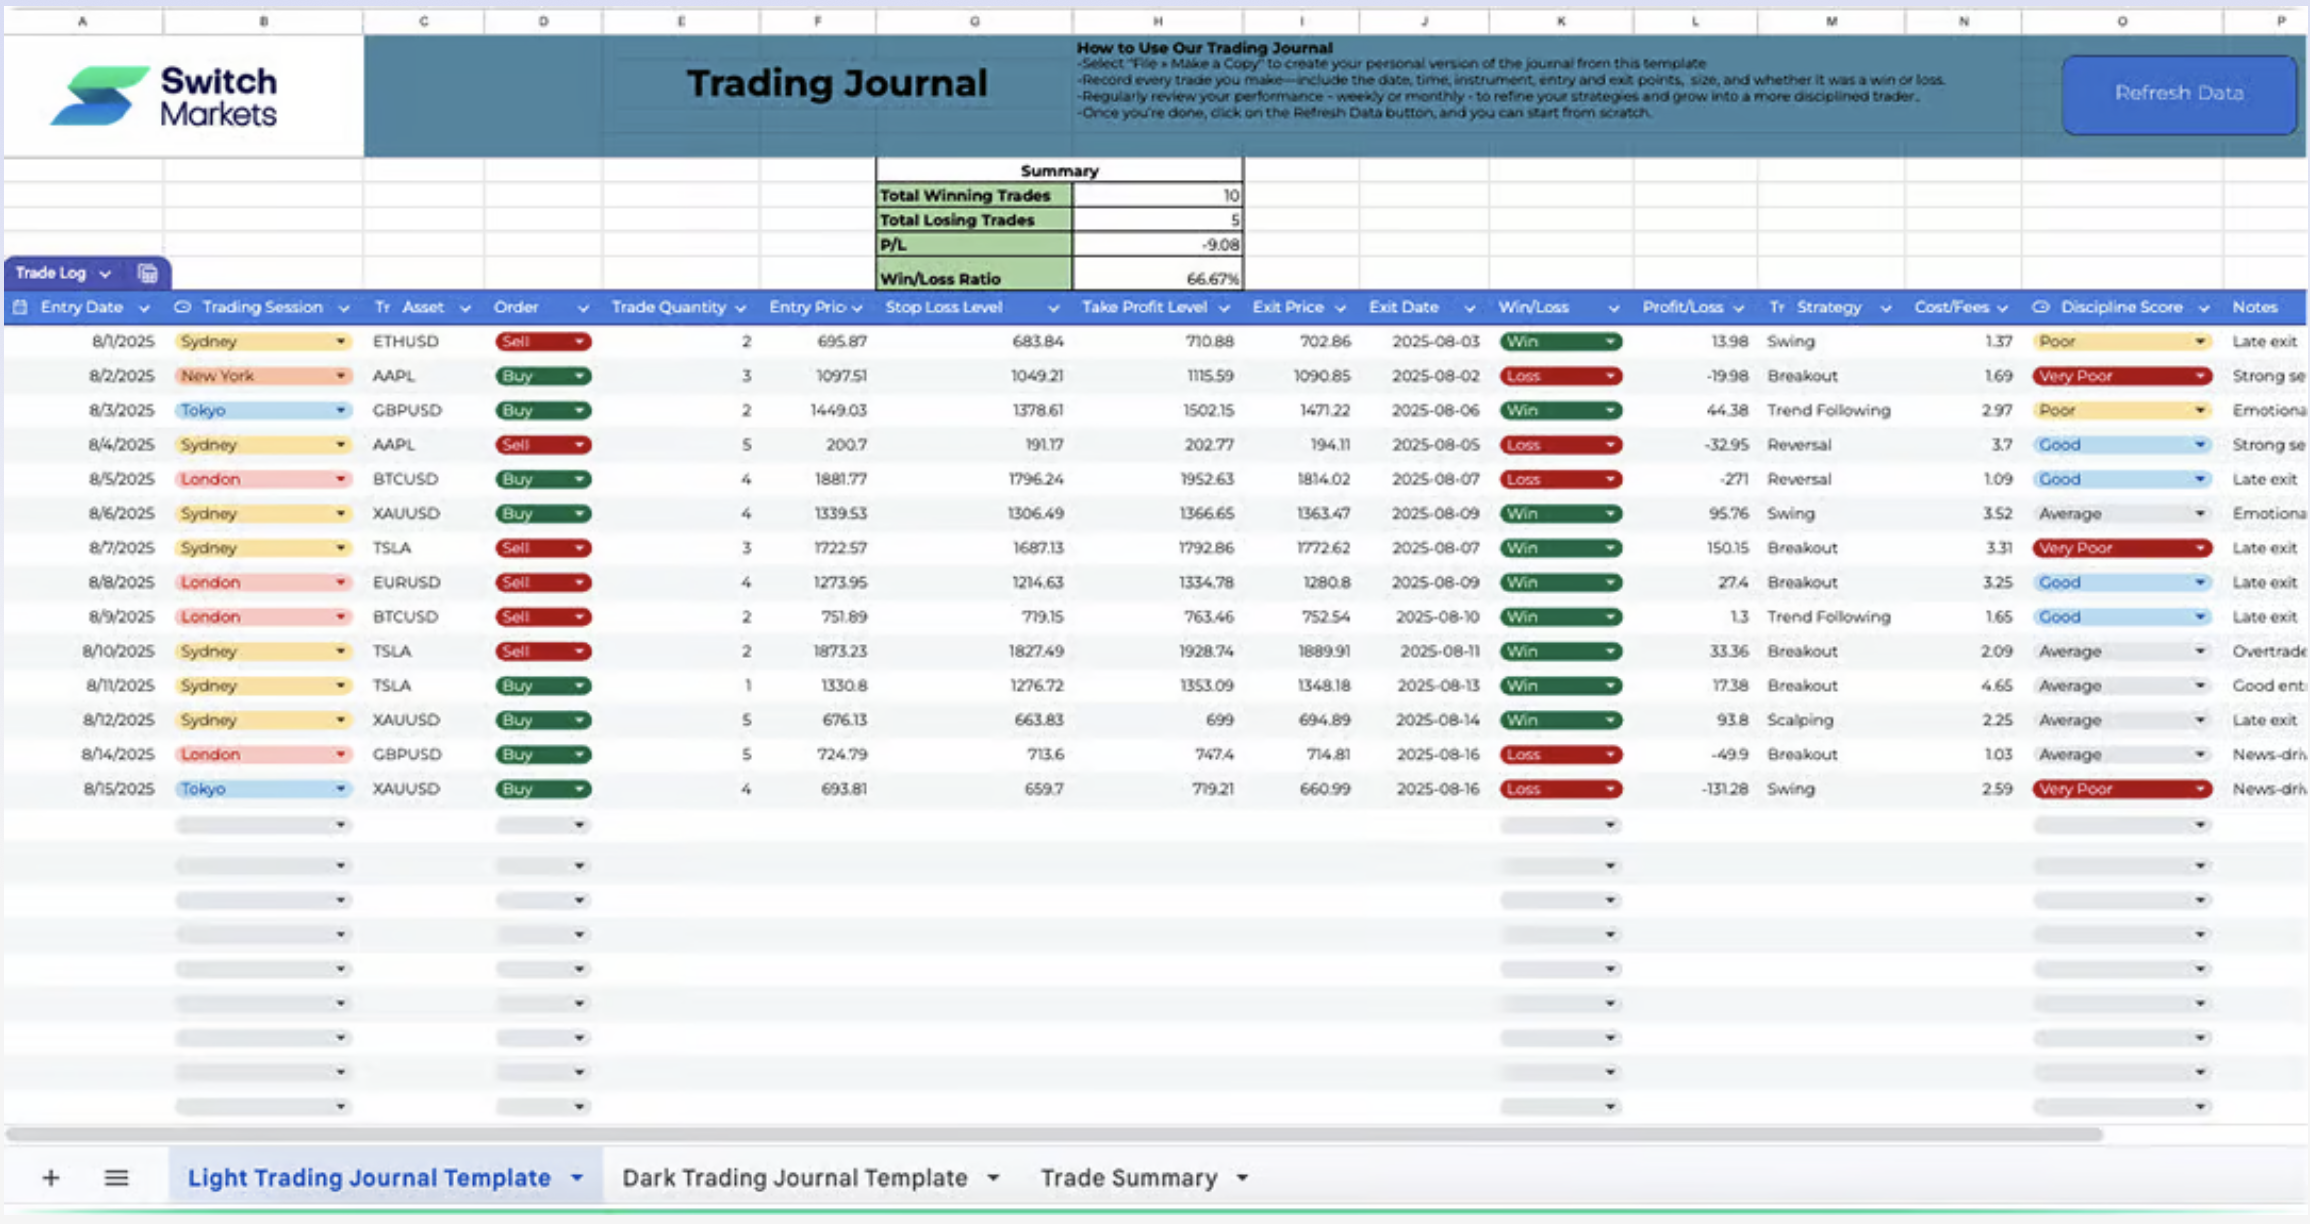
Switch Markets offers a free trading journal template that traders worldwide can download and use immediately. It is designed for both beginners and experienced traders, covering live trading and paper trading across forex, indices, and other CFD markets.
What the free template includes:
- A trade log table (one row per trade) with columns for date, instrument, direction, entry, stop, target, exit, R multiple, net P&L, setup tag, emotional state, and lessons learned
- A summary dashboard calculating win rate, net P&L, average win, average loss, and best setup type at a glance
- An optional notes or screenshots section for chart images and extended reflections
Getting started:
- Download our free template
- Make a personal copy (so your data stays private)
- Customize the instrument list and set up tags for your trading style
- Log your first 20–30 trades before drawing any conclusions
Combining this free trading journal with a reliable trading environment-such as running MT4 or MT5 ensures the data reflects consistent execution quality rather than random disconnections or platform issues.
Step-by-Step: How to Use Your Trading Journal Each Day
The goal is to keep the daily trading process simple enough that you stick with it, even when taking many trades.
Pre-market (5 minutes):
- Set daily goals: max risk (e.g., 2% of equity), max number of trades (e.g., 3)
- Review open positions and overnight developments
- Prepare a watchlist with key levels and planned setups
- Note the emotional state-are you calm, distracted, stressed?
Intra-day (30 seconds per trade):
After placing each trade, immediately log core fields: instrument, entry, stop, planned target, risk, setup tag, and emotional state. Do not wait until the end of the week. A trading journal captures entry reasons and emotional states most accurately when recorded in the moment.
End of day (10 minutes):
- Complete missing fields: exit price, R multiple, net P&L
- Answer quick reflection questions: "Did I follow my trading rules?" and "What was today's main mistake?"
- Assign a discipline score (e.g., 1–10) to the day overall
Reviewing trades can improve decision-making and execution the very next session. Daily, weekly, and monthly reviews enhance trading discipline and performance-the daily log is where it starts.
Traders running automated strategies via Expert Advisors can schedule a daily 10–15 minute review to import trade history, label trades with context tags, and note any execution anomalies or VPS-related issues. It is also recommended to connect AI trading tools to your trading journal via MCP.
Weekly and Monthly Review: Turning Data Into Improvement
The real power of a trading journal appears during structured reviews, not during daily data entry. Data collection is necessary; data analysis is where improvement happens.
Weekly review routine (review weekly, 20–30 minutes):
- Filter past trades by setup tag
- Calculate win rate and average R for each setup
- List the top 1–2 profitable setups and the worst performers
- Count how many losing trades came from breaking rules vs. valid losses following the plan
- Check emotional state patterns-did anxious or rushed entries correlate with losses?
Weekly reviews of your journal reveal profitable setups and weekly reviews help identify profitable setups and costly habits. Regular reviews of a trading journal help identify strengths and weaknesses in trading that daily logging alone cannot surface.
Monthly review (1–2 hours):
- Equity curve shape: smooth growth or jagged swings?
- Largest drawdown and maximum consecutive losses
- Whether strategy performance changed with different market conditions (trending vs. range-bound months)
- Sessions or times of day where P&L is weakest
Paper Trading vs. Live Trading: Journaling Both
Journaling paper trading is just as important as journaling live trades. Paper trading lets you test new strategies without financial risk, but only if you track results with the same rigor.
Use the same free trading journal template for paper trading. Clearly mark account type (paper vs. live), track P&L in R multiples, and focus on whether the strategy behaves as expected in different market conditions. This keeps your data comparable across account types.
Psychological responses differ between paper and live trading. Many traders discover that setups they execute flawlessly on demo fall apart when real money is at risk. Log emotional state in both environments to see how behavior changes when capital is on the line. Keep in mind that Switch Markets also offers a non-expiring demo account, which means you can always compare both scenarios.
Recommended progression:
- Test a strategy on paper trading-journal at least 30–50 trades
- Evaluate positive expectancy and rule adherence
- Move to a small live size while continuing to journal every trade
- Scale up only when live results confirm paper results
Overall, combining paper trading, a journal, and a stable execution environment ensures results reflect strategy quality, not platform or connection issues.
Digital, Spreadsheet, or Software: Where to Keep Your Journal?
The three main options each have trade-offs.
A simple spreadsheet plus a free template is ideal for most traders. It is free, flexible, easy to back up, and supports formulas for P&L, R multiples, and profit factor. For traders with a moderate number of trades, it covers everything you need.
Software becomes useful for high-frequency or intraday traders placing many trades per day. Tools like Trackatrader, which is offered for free to all Switch Markets clients, add auto-import, tagging, and analytics. Some platforms include an AI assistant for summarizing performance.
Regardless of the platform, traders still need to manually enter subjective fields like emotional state, market context, and lessons learned. No tool can guess those reliably.
Traders using MT4 or MT5 with Expert Advisors can export their trade history periodically into the Switch Markets free template, combining automation with detailed qualitative notes.
Final Word
In sum, a trading journal is more than a record of your entries, exits, and profits or losses. It's a tool that helps you understand your trading behavior, identify recurring mistakes, and discover which strategies work best under different market conditions.
The key is consistency. Make a habit of recording your trades, reviewing your performance, and learning from both winning and losing positions. Over time, these insights can help you improve your decision-making, strengthen your risk management, and become a more disciplined trader.
To help you get started, Switch Markets offers a free Trading Journal Excel Template that you can use to record your trades, track performance, and monitor your progress. Download the template, start documenting your trades, and turn your trading history into a valuable learning tool.
Remember, better trading starts with understanding your own decisions.
FAQ
Do I really need to journal every single trade?
In the first months, yes. Gaps in data make patterns and statistics unreliable. If you skip only losing trades or only emotional trades, you bias the journal and hide the behaviors that most need attention. Once the process is stable and your trading rules are clear, you might skip micro-scalps, but full journaling for at least 30–50 trades per setup is recommended before making exceptions. A journal that captures every single trade gives you the clearest edge assessment.
How long before my trading journal becomes useful?
Process metrics like plan adherence ("Followed plan? Y/N") can reveal discipline trends in as little as two weeks for active traders. More robust statistics-such as expectancy per setup tag or realistic win rate-usually require 30–50 closed trades per strategy or market condition. This is still much faster than trading based on gut feeling for years without clear data on why your P&L fluctuates. Even over a decade of experience cannot substitute for structured data.
What if I trade many markets and take many trades per day?
Simplify the journal to high-impact fields only: setup tag, R multiple, plan adherence, emotional state, and one lesson. Group trades by strategy or session (e.g., "London breakout batch") and add a summary note rather than writing a paragraph per journal entry. High-frequency traders and those managing multiple accounts can export fills from MT4/MT5 into the free template, then use filters and pivot tables to review performance in batches. Other traders in similar situations find that focusing on the best journal fields, not every possible data point, keeps the habit sustainable.
Can an AI assistant maintain my trading journal for me?
AI can analyze trading journals for patterns and insights-summarizing notes, clustering similar mistakes, or highlighting which setups have the best trading results. However, it cannot reliably infer your emotional state or reasoning without your input. The trader is responsible for writing short, factual notes; AI can then organize, search, and surface patterns. Combining human context with AI analysis is more powerful than relying on either alone, but the human input is non-negotiable. No Wall Street Journal algorithm or trading journal software can replace your honest self-assessment.
Is a free trading journal template enough, or do I need paid software?
For most swing and day trading styles, a structured free template like the one from Switch Markets in Excel or Google Sheets is more than enough to track P&L, R multiples, setup quality, and behavior. Paid software adds convenience: auto-import trades from brokers, chart overlays, and sometimes built-in AI insights. These features help very active traders or those managing multiple accounts across futures, forex trading, and other financial markets. Start with a free version, build a consistent habit, and only upgrade when trade volume or complexity makes manual updating impractical. The best trading journal is the one you actually use every day-and the support team behind any tool matters less than your own commitment to stay accountable and build discipline through honest, regular use.
Risk Disclosure: The information provided in this article is not intended to give financial advice, recommend investments, guarantee profits, or shield you from losses. Our content is only for informational purposes and to help you understand the risks and complexity of these markets by providing objective analysis. Before trading, carefully consider your experience, financial goals, and risk tolerance. Trading involves significant potential for financial loss and isn't suitable for everyone.