7 Top Technical Analysis Strategies to Add to Your Trading Toolkit
Every trader dreams of having that one strategy that works like magic. But here’s the truth: no single setup will win all the time. Markets change, conditions shift, and what works today might fail tomorrow.
That’s why successful traders don’t rely on one strategy but rather have a couple up their sleeves. Think of it like having different tools for different jobs. A hammer can’t do what a screwdriver does, and the same goes for trading. Range trading might save you in sideways markets, while a breakout strategy helps you catch the next big trend.
In this guide, we’ll walk through 7 top technical analysis strategies that every trader should know. These aren’t complicated theories that only PhDs can understand. They’re simple, practical, and effective approaches you can apply directly to your charts.
By the end, you’ll know exactly how to use each one, when to apply it, and why it works.
7 Top Technical Analysis Strategies to Add to Your Toolkit
Below, we are going to show the top technical analysis strategies that you can add to your trading toolkit. And here’s the good news: you don’t need to master all seven at once. Start with one, test it, and build consistency. Then, as you grow, you can layer in the others. Even a seasoned trader continues to refine and adapt their strategies over time.
The goal is to have the right weapon ready for the right market condition. Let’s break them down one by one.
The Range Trading Strategy
Although trading the trend is quite popular among traders, the market does not trend all the time. As a matter of fact, it is estimated that the markets are in range-mode %70-%80 of the time. So, do traders just sit on their hands when the market is in a range? Well, not exactly.
Trading a ranging market requires patience and precision, but can be very profitable, especially for day and scalp trading.
To get a hang of how to trade the range trading strategy, it’s important to define what a range is.
A market is set to be in a range when the market price struggles to break above or below two key levels.
Now that we have defined what a range is, it becomes obvious that the first thing we will have to focus on is the key levels. Most of the range trading strategy is waiting for the price to bounce off the key levels.
To trade this effectively, the first thing we have to do is to map out the key levels that the price keeps returning to. We can call these levels support and resistance levels.
After mapping out these levels, we simply buy when the price hits the support level and sell when it hits the resistance level. It’s as simple as that. At the beginning, you might have to use drawing tools for that, but once you notice a market that is in a range-bound, you'll quickly be able to buy at the support and sell at the resistance.
So, you can take advantage of trading these “micro trends” inside the ranging market. This way, you’re trading a modified range trading strategy.
Example Trade Setup
For example, let’s take a look at the EUR/GBP, which is known for its ranging market condition.
The first thing we are going to mark is the range high and the range low (the resistance and support levels).
We can wait for the price to get to these levels and either sell or buy from them, as illustrated in the chart below.
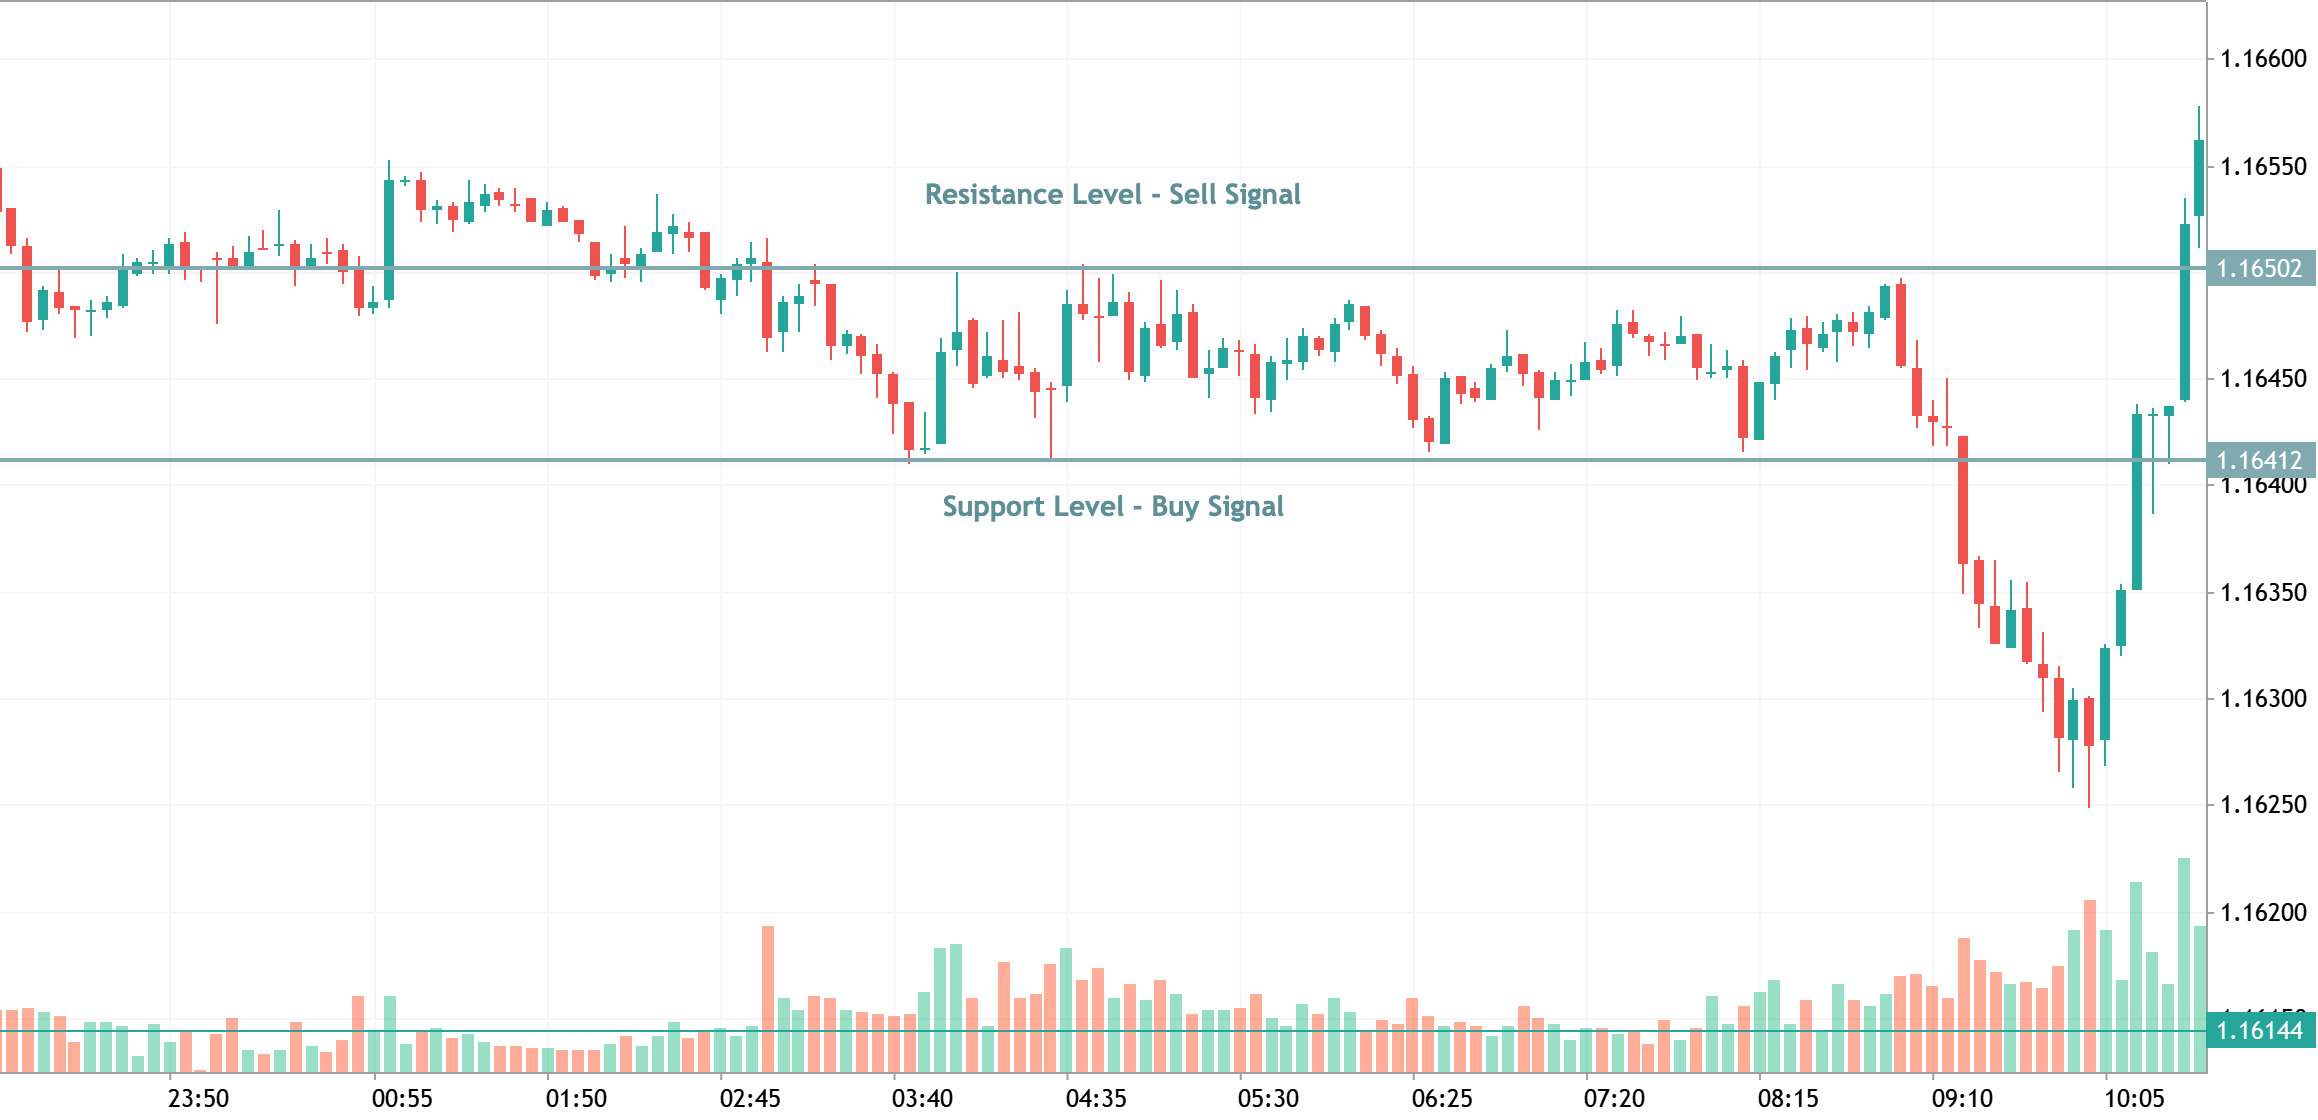
As you can see, it’s not rocket science. You’re simply buying low, selling high, and repeating until the range breaks. You are essentially ‘using’ this market mode to your benefit, which, in some cases, could be extremely profitable.
The Breakout Strategy
A breakout strategy is trading the market after the price has been ranging for a while, or when it's constantly breaking new levels. Usually, the market moves in three phases: accumulation, manipulation, and distribution. In simple terms, the market is either ranging, creating fake outs, or trending. Breakout strategies help traders identify trends early and capitalize on new price movements as the market shifts from a range to a trend.
The goal of trading the breakout strategy is to enter a new trend very early. This way, the risk is low but the reward is significantly higher. Breakout strategies are a type of trend following strategy, aiming to catch the start of a new directional move.
The breakout strategy is often traded using a support and resistance line or a trend line. If you’re using any of these tools, what you want to see is price breaking a major key level. Traders use the price chart to spot breakouts and confirm price movement, analyzing chart patterns and volume to validate the breakout. This could be an all-time high of an asset, the highest level of the day, or simply a breakout of a long range.
However, it is important to be aware of the risks involved with breakout strategies, such as false breakouts and whipsaws. While a novice will jump into the trade after a break, a much more professional way of trading the breakout strategy is to wait for a retest of the level before entering the position. Just doing this can significantly increase your strike rate and help you avoid fake-outs.
Example Trade Setup
If you take a close look at the chart below, you’ll notice that the price spent a prolonged time in the range, moving back and forth between the support and the resistance zone.
Finally, the price broke through the support zone and retested the zone, thereby turning the support zone into a resistance zone before a quick move to the downside. After the breakout, the price falls sharply, indicating strong selling pressure.
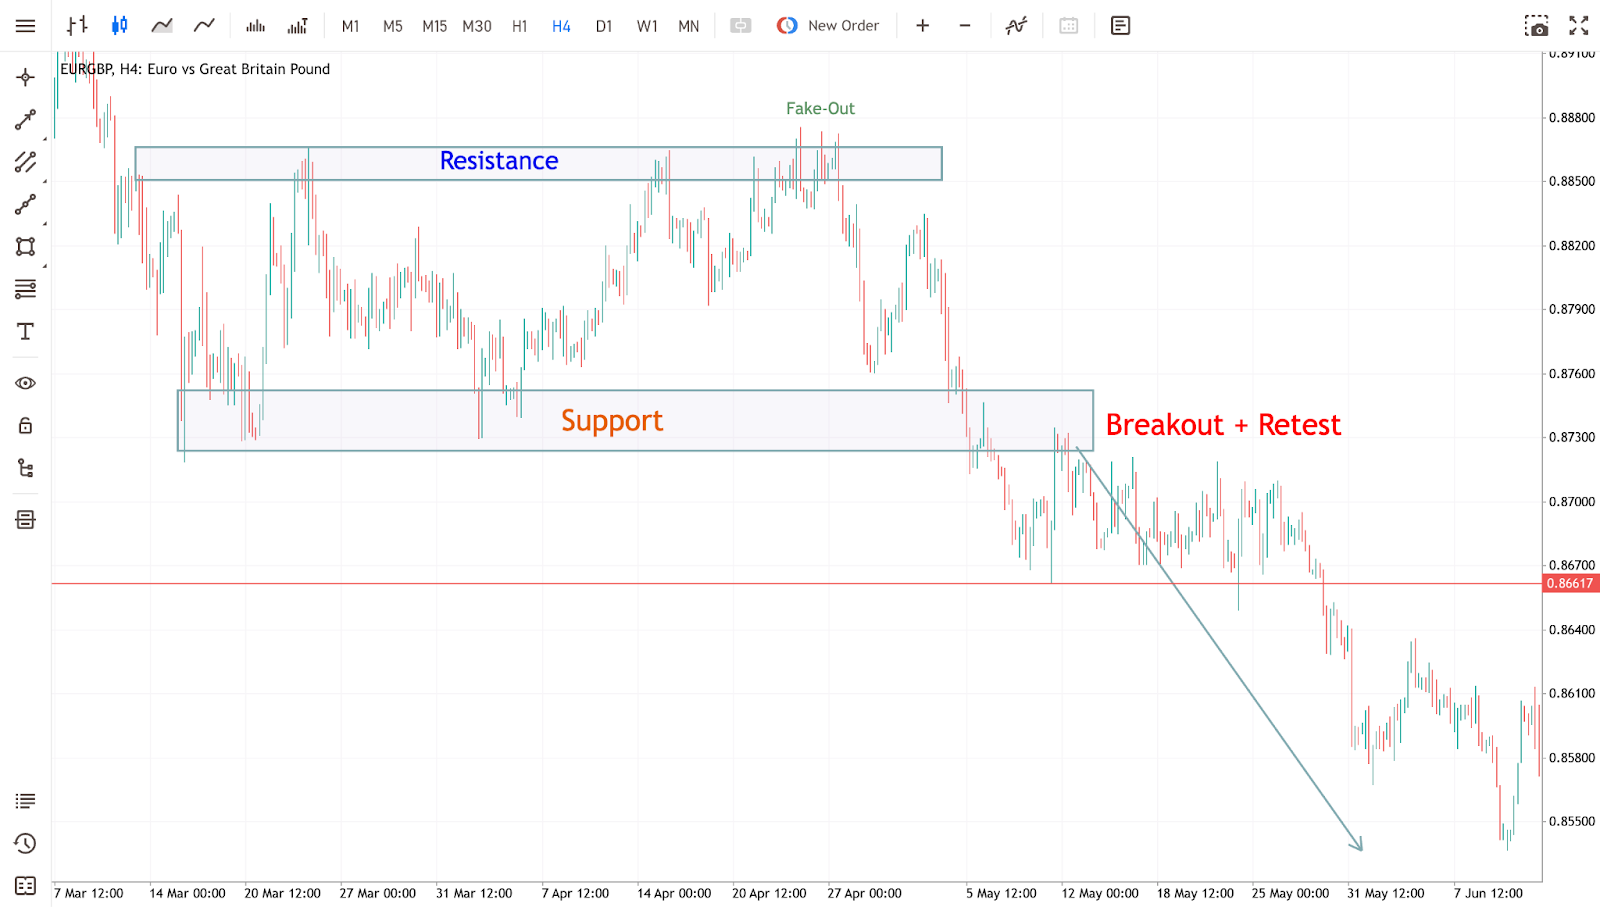
Another thing you’ll notice is a fake-out (fake breakout) above the resistance zone. Sometimes, price and volume can move in the opposite direction during such fakeouts, signaling a potential reversal.
By waiting for the retest, you would have avoided a possible fake-out and caught a cleaner entry into the new trend. After confirmation, the price often continues in the same direction as the breakout, supporting the trend continuation.
The Fibonacci Retracement Strategy
We wouldn’t want to bore you with all the amazing history of how the Fibonacci sequence was discovered, but you can rest assured that this discovery can revolutionize your trading game. If you want a really deep dive, you can simply check out our full guide on Fibonacci trading strategies.
Let’s quickly show you what you need to know about the Fibonacci retracement strategy.
Generally, the market doesn’t just move in the direction of the trend forever. Let’s say in a bullish market, the market doesn’t just continue to go up. No. What happens is that the asset's price will often find little bearish movement even in a bullish trend and vice versa. These little movements are called retracements.
In a solid trend, retracement presents traders with a fresh opportunity to join the trend. This is where the Fibonacci retracement strategy comes in.
If you’re using this strategy in an uptrend, all you have to do is draw your Fibonacci retracement tool from the swing low to the swing high and wait for the price to get to your preferred Fibonacci level and take off from there.
Now, there are various opinions on which levels perform best, but the popular ones are 61.8%, 70%, and 79.1%. You can backtest all of these using historical data to determine which retracement levels are most reliable and stick to what works for you. You can also use Algo Builder, our free AI trading tool, which enables you to automate trading strategies without coding.
Example Trade Setup
In our example, Gold rallied from 2595.82 (swing low) to 2665.29 (swing high). Instead of chasing the move, you pull out your Fibonacci tool and draw from the low to the swing high.
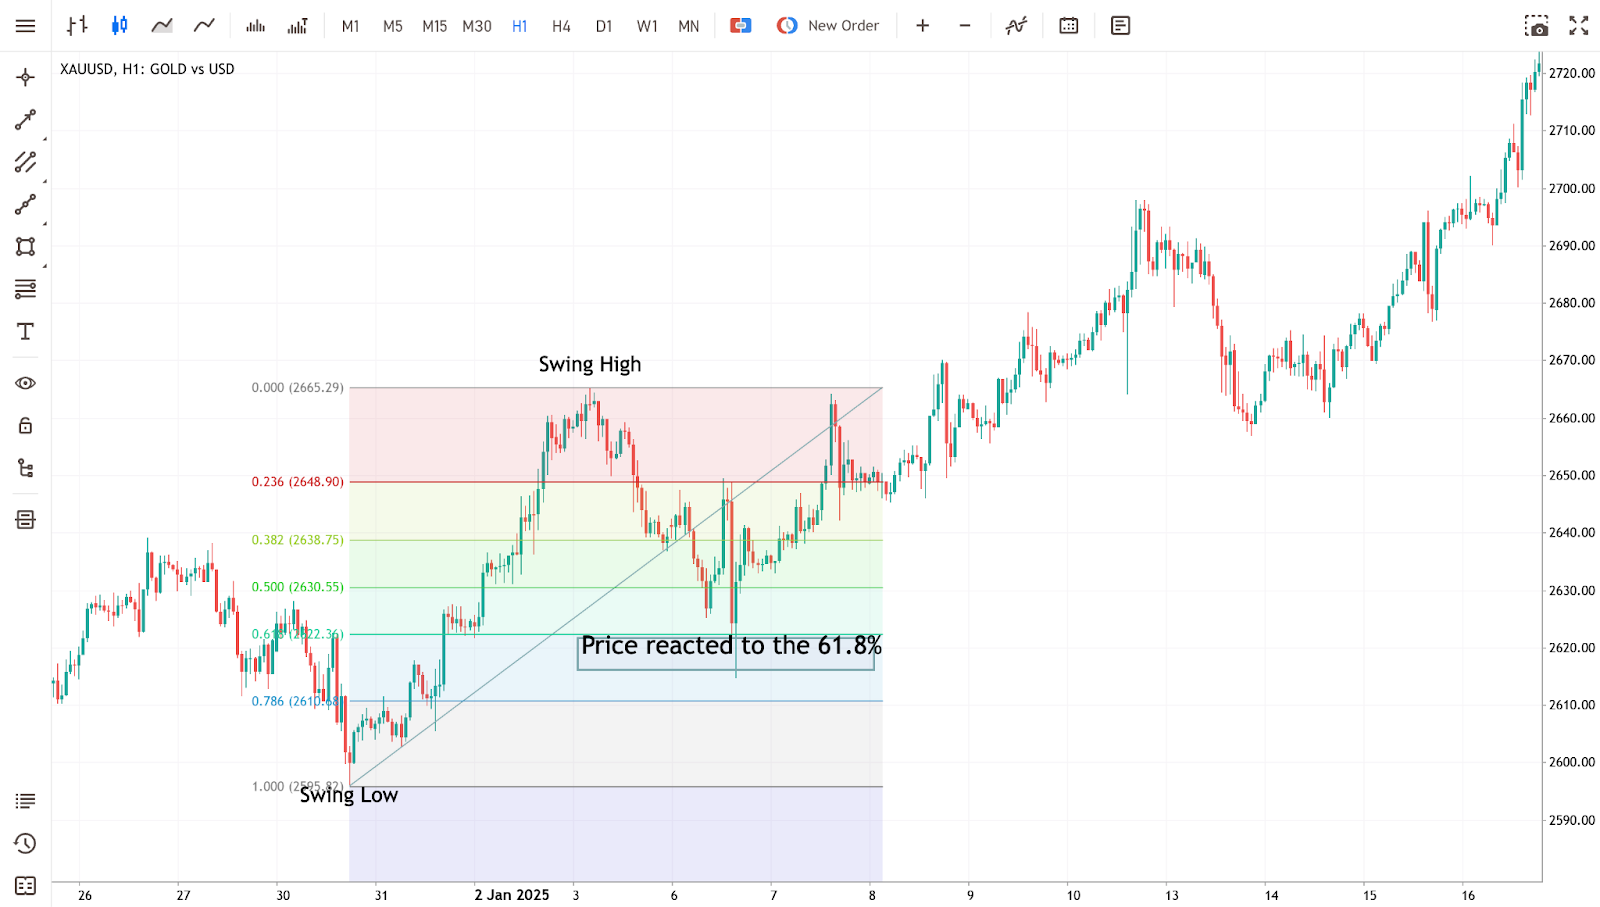
Price retraces back to the 61.8% level around 2622.36. At that point, a bullish pin bar forms. That’s your signal to enter the trade.
You enter a buy trade at the candle close, place your stop just below the swing low, and target the previous high at 2665.29. The market respects the Fib level and shoots back up, giving you a textbook retracement entry.
The 5-8-13 EMA Strategy
The moving average might be one of the simplest tools in technical analysis, but combine three of them and you get a powerful strategy. That’s exactly what the 5-8-13 EMA strategy does, and it involves analyzing the intersection of the 5, 8, and 13 EMAs to generate trading signals.
Here’s how it works. When the 5 EMA crosses both the 8 EMA and the 13 EMA, that’s your signal to enter a trade. Simple, right? EMAs can also serve as momentum indicators, helping traders gauge the strength and direction of a trend.
But there’s one condition you can’t ignore: for a buy, the price has to be above all three EMAs. For a sell, the price must be below all three. This keeps you trading in the right direction and avoids unnecessary whipsaws.
Wait for the first candle to close after the cross before pulling the trigger. That extra step saves you from false signals.
For setup, traders usually color-code their charts for clarity: 5 EMA in red, 8 EMA in blue, and 13 EMA in purple. This way, you know exactly which line is which in the heat of the market.
Here's a video explaining how the 5-8-13 EMA strategy works:
Example Trade Setup
As you can see in the chart below, USDJPY has been trending upwards. Price has been retracing for a while, but suddenly the 5 EMA (red) crosses above both the 8 EMA (blue) and the 13 EMA (purple). At that moment, the price is also clearly above all three moving averages.
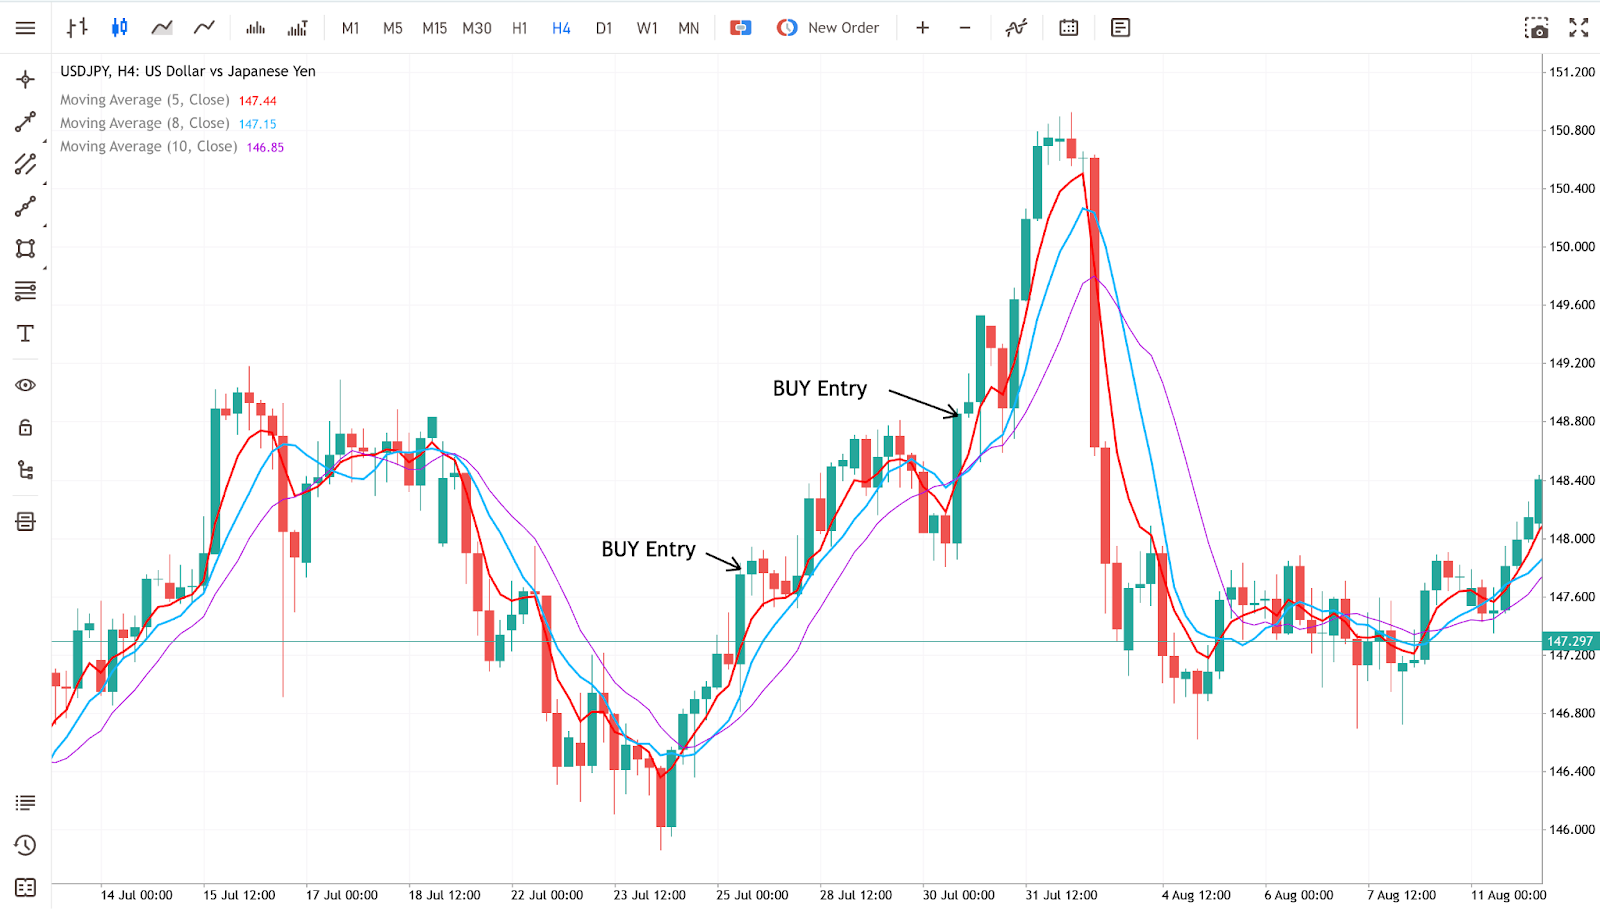
Instead of rushing in, you wait for the current candle to close above the EMAs. Once it does, you enter a buy. Stop loss goes just below either the signal candle or the swing low. The choice is yours here. For targets, you can use recent swing highs or a fixed risk-reward ratio like 1:1. But test and find whichever works for you and stick to it.
This way, you’re not just guessing, but you’re using a structured, rules-based entry.
The Volume Trading Strategy
Volume is like the market’s heartbeat. It tells you how strong or weak a move really is. Analyzing volume helps traders understand underlying market behavior, revealing the conviction behind price movements.
Think about it: if the price is rising but the volume is dropping, the rally is running out of fuel. On the other hand, if price breaks a key level and volume spikes, that’s usually the real deal.
Using volume in your trading strategy helps you separate genuine moves from fake-outs. For example, when a breakout happens, many traders wait for higher-than-average volume before entering. This way, you know the market has enough participation behind the move.
While we don’t recommend starting out trading volume on its own, a technical trader often combines volume analysis with other technical tools like support and resistance, trendlines, or moving averages to make informed decisions. If price touches support and you notice volume picking up on the bounce, that’s a strong signal. The same goes for selling into resistance on heavy volume.
Example Trade Setup
On the NQ 100 chart, price has been respecting a key level around 23600, which acted as a support zone in the past and a support-turned-resistance zone recently. However, the price finally breaks above the resistance. On the breakout candle, you notice volume spiking higher than the 2000-period average. That’s your confirmation.
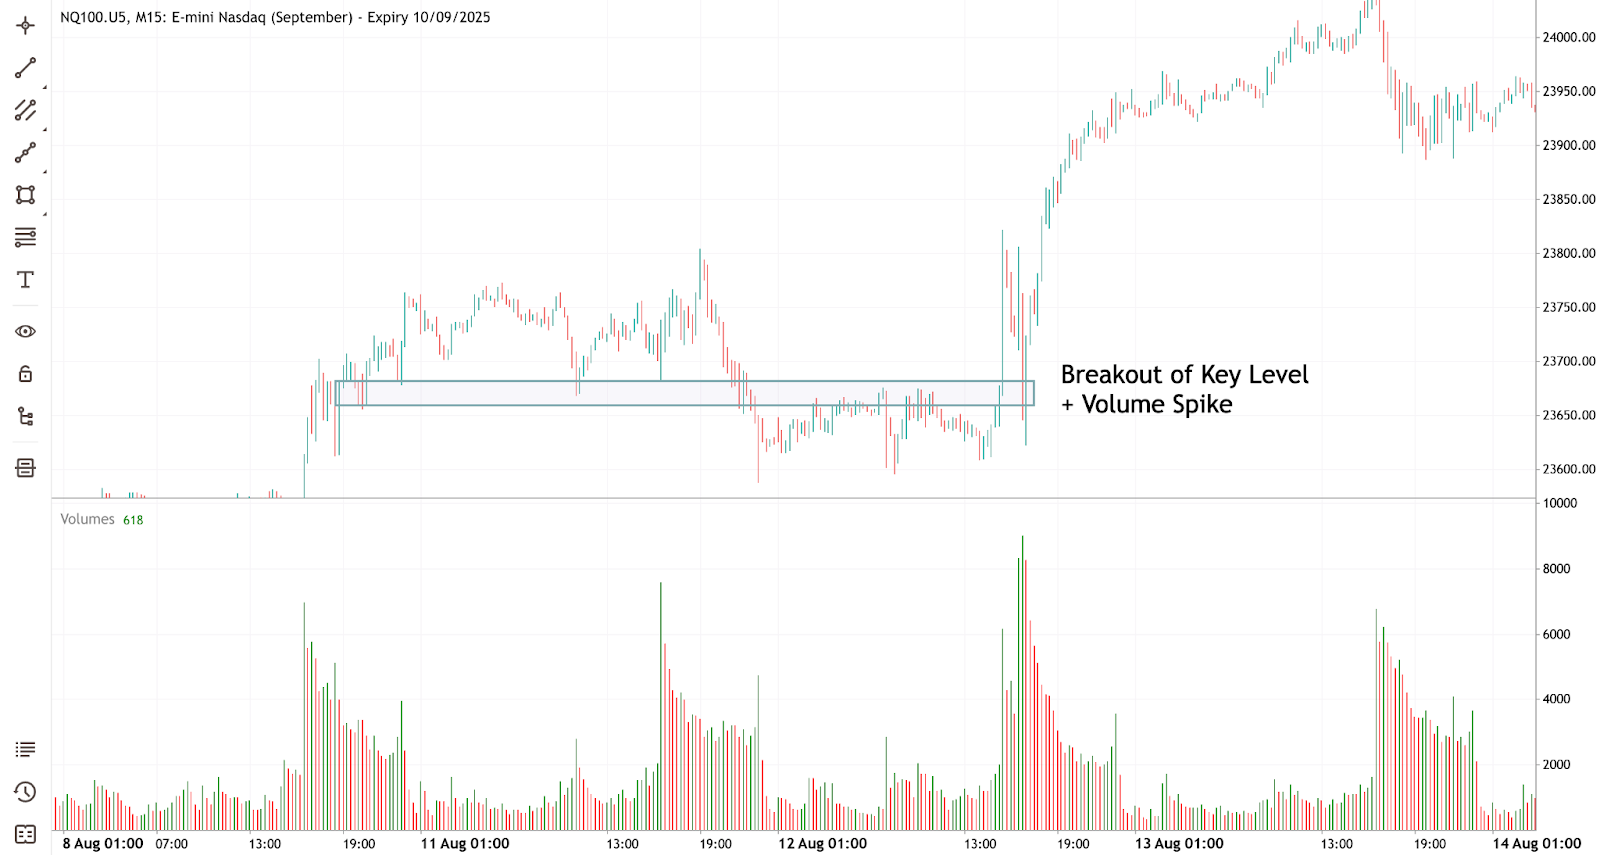
So, you enter a buy just above the breakout level with your stop loss tucked below the recent low. Price pushes higher quickly because other traders also spot the volume spike and pile in. That’s the power of aligning price action with volume.
The 9 EMA Strategy with RSI Confirmation
If you like precision, this one’s for you. The 9 EMA strategy with RSI confirmation is a specific RSI trading strategy widely used by technical traders. It gives you both momentum and overbought/oversold signals in one neat package. The RSI is one of the most popular technical indicators and serves as a key technical indicator for identifying overbought and oversold stocks.
Here’s the setup. We use the 9 EMA to track short-term direction. Then, we pair it with the RSI for confirmation.
The rules are straightforward:
- Buy when RSI is oversold and price closes above the 9 EMA. This helps identify oversold stocks for potential entry.
- Sell when RSI is overbought, and price closes below the 9 EMA.
Now, let’s talk about timing. If you’re trading Nasdaq, stick to the New York session and focus on the 15-minute or 30-minute chart. That’s when the market is most active. If you’re trading forex pairs, the 4-hour timeframe is a better fit.
This combination of RSI and EMA is favored by technical traders who often rely on this approach for precise entries. It’s a strategy that helps you find balance between momentum and market exhaustion.
For a step-by-step breakdown, you can watch this video. It walks you through examples and shows you exactly how to apply the strategy in live markets.
Example Trade Setup
To illustrate how this strategy works, let’s test it out in the forex market. AUDCAD, 4-hour timeframe. We see price consistently moving from one overbought zone to another oversold zone and back. So, how do we capitalize on these moves?
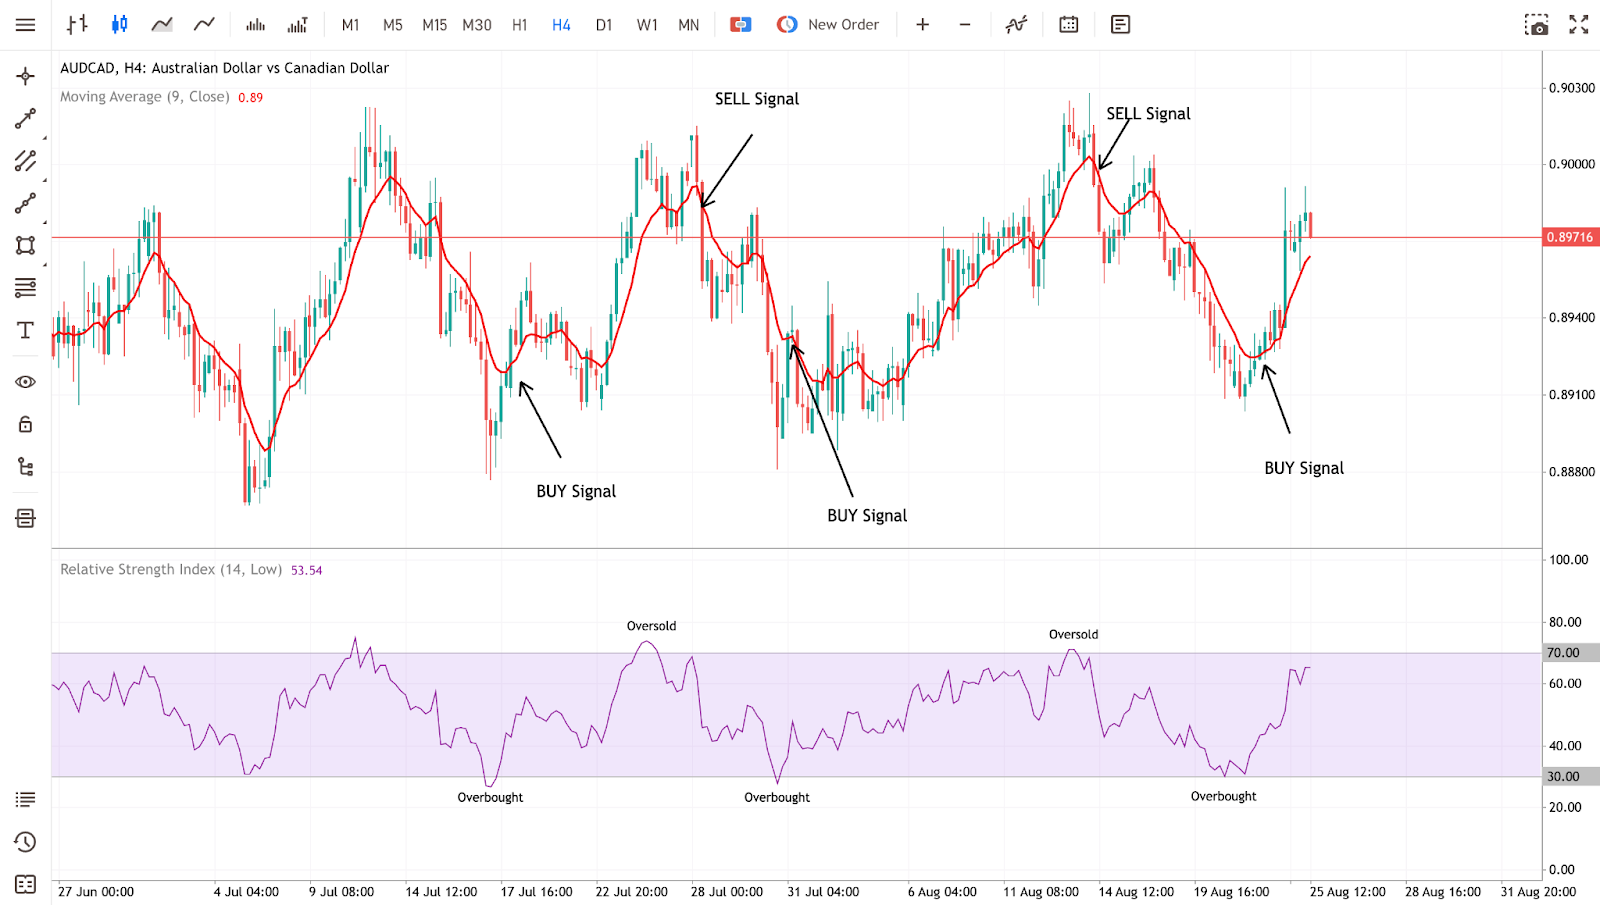
If we are looking to buy the market, all we have to do is wait for the price to close above the 9 EMA while the price is either in an oversold level or it’s just coming from one.
On the flip side, we sell only when we see that price has closed below the 9 EMA while also in either an overbought level or just coming from one.
The Support and Resistance Strategy
Support and resistance are the backbone of technical analysis. Almost every strategy you’ll ever use is built on this concept in one way or another. Support and resistance levels are often combined with price patterns to improve trade accuracy, as analyzing these patterns helps identify trends, reversals, and forecast future price movements.
A support level is simply a price area where buyers keep stepping in. Resistance is the opposite; it is where sellers consistently push the price down. Spot these zones, and you’ve already got an edge.
Trading them is straightforward. Buy when the price approaches support, sell when it nears resistance. But here’s the catch: always wait for confirmation. Candlestick patterns like pin bars or engulfing candles are a great way to confirm the bounce.
Another way to trade support and resistance is to combine them with other technical analysis tools like Fibonacci, DeMarker, etc. Another excellent way is to use volume indicators. You can simply combine them with almost all of the other trading strategies we’ve already mentioned, and it instantly boosts their win rates. Mastering support and resistance is essential for successful technical trading.
Example Trade Setup
In this example, we’re going to combine the support and resistance strategy with a DeMarker Indicator for confirmation.
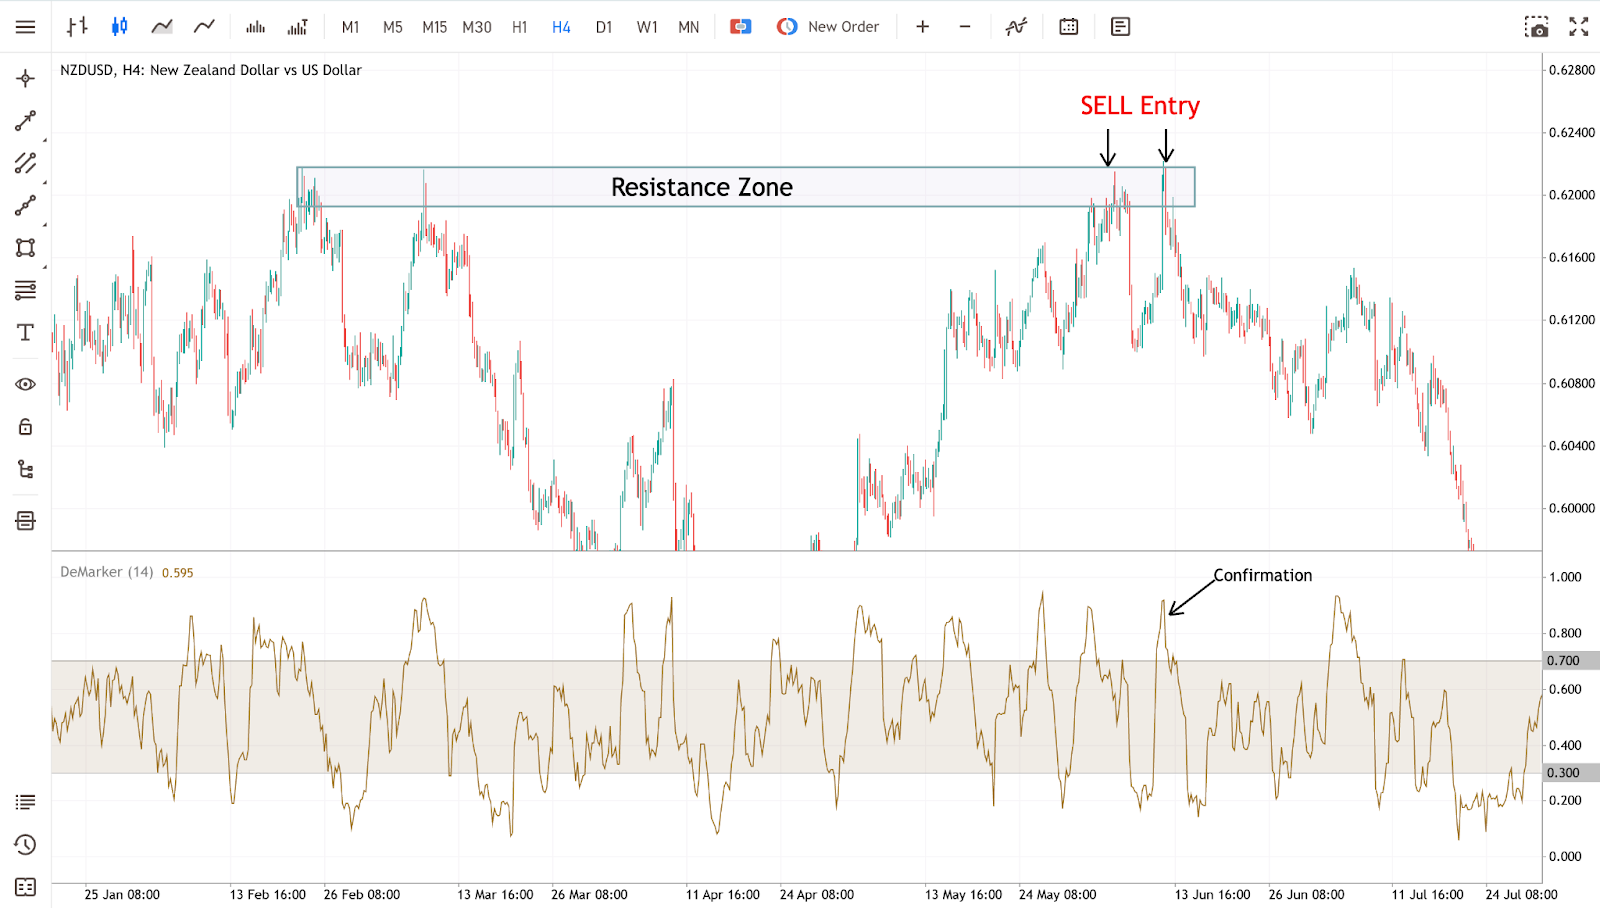
As we can see from the chart above, the price returned to the resistance zone twice while also giving us an overbought signal on the DeMarker tool. This gives us a solid signal that the market is about to go down.
In this scenario, you can either decide to hit the SELL button immediately or wait for a bearish candlestick formation before entering the trade. Either way, you should place your SL above the high of the move and enjoy the ride.
Backtesting and Optimization
Before risking real money in the markets, it’s essential to know whether your trading strategy actually works. That’s where backtesting comes in. Backtesting involves running your strategy through historical market data to see how it would have performed in the past. This process helps you spot potential flaws, fine-tune your approach, and build confidence in your trading plan.
Optimization takes things a step further by adjusting the parameters of your strategy, like entry and exit points, risk tolerance, or trading volume, to achieve the best possible results under different market conditions. By using technical analysis tools such as chart patterns and technical indicators, you can identify potential entry and exit points and test how your strategy responds to various scenarios.
For example, you might use the relative strength index (RSI) to identify overbought and oversold conditions in historical price data, helping you refine your approach to catching market reversals. Backtesting also allows you to evaluate your strategy’s performance across different timeframes and market environments, ensuring it’s adaptable and effective.
Ultimately, backtesting and optimization give you the data-driven insights needed to make informed trading decisions and increase your chances of success in live markets. And this can be done on a demo account. For that matter, take note that Switch Markets is one of the few brokers offering a non-expiring demo account, which is ideal for those who constantly want to backtest their trading strategies.
How to Manage Your Risk
No matter how strong your trading strategy is, managing risk is crucial to long-term success. Technical analysis can play a big role in risk management by helping you spot potential trend reversals and shifts in market sentiment. For instance, indicators like the stochastic oscillator can alert you to changes in momentum, while support and resistance levels help you identify where price might stall or reverse.
Effective risk management also means using tools like stop-loss orders to limit potential losses and position sizing to ensure you’re not overexposed to any single trade. Understanding trading psychology and recognizing selling pressure, using indicators such as on-balance volume (OBV) and the money flow index (MFI), can further help you gauge when to step back or adjust your positions.
Every trader has a different risk tolerance and trading style, so it’s important to develop a risk management plan that fits your personal approach. Many traders start by practicing on a demo account, allowing them to test strategies and refine their risk management techniques without putting real capital at risk. By combining technical analysis with sound risk management, you’ll be better equipped to navigate the ups and downs of the market.
To learn more, we suggest reading our guide on the 5 risk management trading techniques for day traders.
Wrapping Up
There you have it! Seven powerful technical analysis strategies you can add to your trading toolkit.
We started with range trading and breakout setups, moved through Fibonacci retracements, and layered in EMA strategies, volume analysis, and the evergreen support and resistance. Each one has its place. Each one works when applied with patience and discipline.
Do you need to master all of them at once? Not at all. The smartest traders pick one or two, test them, and build consistency before adding more tools.
The real edge is in mastering the ones that fit your style. Combine that with solid risk management, and you’ll be ahead of most traders out there.
At the end of the day, trading is about probabilities, not certainties. These strategies give you a higher probability of success, but it’s your discipline that decides the outcome.
Now the ball is in your court. Which strategy will you start testing first?
Join Switch Markets - Open a Trading Account
FAQs
Before we wrap this up completely, let’s quickly clear up some common questions traders usually ask when it comes to technical analysis strategies.
Which technical analysis strategy is best for beginners?
There’s no single “best” strategy, but the 9 EMA and RSI strategy is usually the easiest place to start. It’s simple, visual, and doesn’t require much analysis.
Can I use these strategies on any market?
Yes, you can. Forex, stocks, indices, and crypto all respond to technical levels. The only difference is the timeframe you choose. For example, intraday traders might use 15-minute charts, while swing traders prefer 4-hour charts. Same strategies, just adapted to the market.
How do I avoid false signals when trading breakouts?
The trick is to wait for confirmation. Don’t jump in on the first candle that pushes through a level. Instead, wait for volume to spike or for price to retest the level after breaking it. This simple step filters out a lot of fake-outs.
Should I trade with multiple strategies at once?
Not at first. The smarter approach is to master one strategy until you’re confident and consistent. Once you have that foundation, you can slowly add more tools to your arsenal. Trading too many systems at once only creates confusion.
Risk Disclosure: The information provided in this article is not intended to give financial advice, recommend investments, guarantee profits, or shield you from losses. Our content is only for informational purposes and to help you understand the risks and complexity of these markets by providing objective analysis. Before trading, carefully consider your experience, financial goals, and risk tolerance. Trading involves significant potential for financial loss and isn't suitable for everyone.