Range Trading Strategy: A Practical Approach to Sideways Markets
Every trader always wants to take advantage of sharp trends; some even take and post screenshots of them. However, between these trends sit long stretches where price goes nowhere in particular.
The truth is, while most traders treat those stretches as waiting time, range traders treat them as the main event.
That's the idea behind a range trading strategy. Instead of waiting for a trend that may not come, you trade the sideways market in front of you: buy near support, sell near resistance, and step aside when the structure breaks.
In this guide, we'll cover how to tell a real range from a pause, the indicators worth keeping, four of the most effective range trading strategies, and the risk rules that stop small wins from turning into big losses. Let’s go!
First, What Is Range Trading?
So… what is range trading? Range trading profits from price fluctuations between support and resistance. When price drops into the lower part of a defined range, you buy. When it rises into the upper boundary, you sell or go short. When you’re trading within a range, expecting a big directional move is a pipe dream. Rather, you only bet on price staying within that price range. Some traders call it range-bound trading. Same thing.
Two terms do most of the work:
- Support is a price level where buying interest has been strong enough to stop price from declining further.
- Resistance is a level where selling pressure has stopped price from rising higher.
Both come from past price action. A level earns its name because price reached it, turned around, and did it again. Each clean reaction makes the next more likely, because more traders are watching the same key levels.
All of this is just mean reversion at work. Inside a range, price that stretches to one edge tends to drift back toward the middle. Breakout traders bet the range is about to end. Range traders bet it isn't. Not yet, anyway.
Why Range Trading Works
There's a line repeated on almost every trading forum: markets range 70% of the time. Nobody seems able to find the study behind it, but the point behind it holds up, though. Clean, persistent market trends are the exception. Most of the time, price is ranging.
Think of it this way: a market is an auction. When buyers and sellers broadly agree on what something is worth, price moves back and forth inside a band both sides are happy to trade in. It is known as price equilibrium. It takes something new to break that agreement: a rate decision, an earnings surprise, a genuine shift in market sentiment. Until then, prices fluctuate, and the market waits.
You can see it every week. EUR/USD often drifts a few dozen pips through the Asian session. A stock that has just rallied can go sideways for weeks while early buyers take profit. That sideways price movement is the market in balance, and that balance is what makes range-bound markets tradable.
It's also why range trading works best in non-trending markets with fairly predictable price movements, and why it fails so badly in a strong trend.
How to Identify a Ranging Market
Trading a range is the easy part. Deciding whether you're looking at one, rather than a pause inside a trend, takes careful analysis.
1. Count the Touches
Start with a clean price chart and no indicators. A tradable range usually has at least two clear price bounces off the top and two off the bottom, roughly horizontal highs and lows, and enough distance between the upper and lower boundaries to cover your costs. If you have to squint to see it, it isn't there.
2. Draw Zones, Not Lines
Price might turn at 1.0850 on Monday, 1.0846 on Wednesday, and 1.0857 on Friday. Draw thin support and resistance lines at 1.0850, and you'll think the level broke twice. A good rule is to treat support and resistance levels as zones rather than exact points, marking the area where reactions cluster. Entries go inside the zone. Stops go clearly outside it.
3. Confirm with ADX
The Average Directional Index (ADX) measures trend strength, not direction. ADX values below 20 suggest a weak or absent trend, which is the environment range trading needs. Watch the slope as well. A low ADX that starts climbing is often the first warning that the range is about to end.
4. Check the Higher Timeframe
A 15-minute range inside a strong daily downtrend is a different trade from one on a flat daily chart. The prevailing trend tells you which boundary is more likely to break eventually. In a downward trend, support levels are the weaker side, so take profits on longs sooner.
Best Range Trading Indicators
You don't need a screen full of technical analysis tools to trade ranges. Two indicators you understand will beat six that argue with each other.
One caution about the relative strength index. In a trend, RSI can sit above 70 for days while price keeps climbing. Inside a range, it behaves the way the textbooks promise, because momentum keeps running out at the edges. An RSI reading below 30 as price reaches key support carries far more weight than either signal alone. Flip it, and you get sell signals near resistance. And if you use volume analysis on forex, remember that spot FX volume is tick volume from your broker's feed, so treat it as a rough gauge.
You can work out pivot levels in seconds with our pivot point calculator, and our moving averages guide covers which settings suit different trading styles.
4 Range Trading Strategies You Need to Know
There's no single best range trading strategy. The right one depends on your specific market and timeframe, but the four range strategies below are the ones traders use most, and none needs more than one indicator. Start with the first, then add the others as your trading experience grows.
1. The Support and Resistance Bounce
This is range trading in its plainest form: buy near support, sell near resistance.
How the Strategy Works
Split the range into thirds. Buy only in the bottom third and sell only in the top third, because entries in the middle give you a poor risk-reward ratio. Inside the zone, wait for confirmation rather than buying the moment price hits it, such as a long rejection wick or a bullish engulfing candle at support.
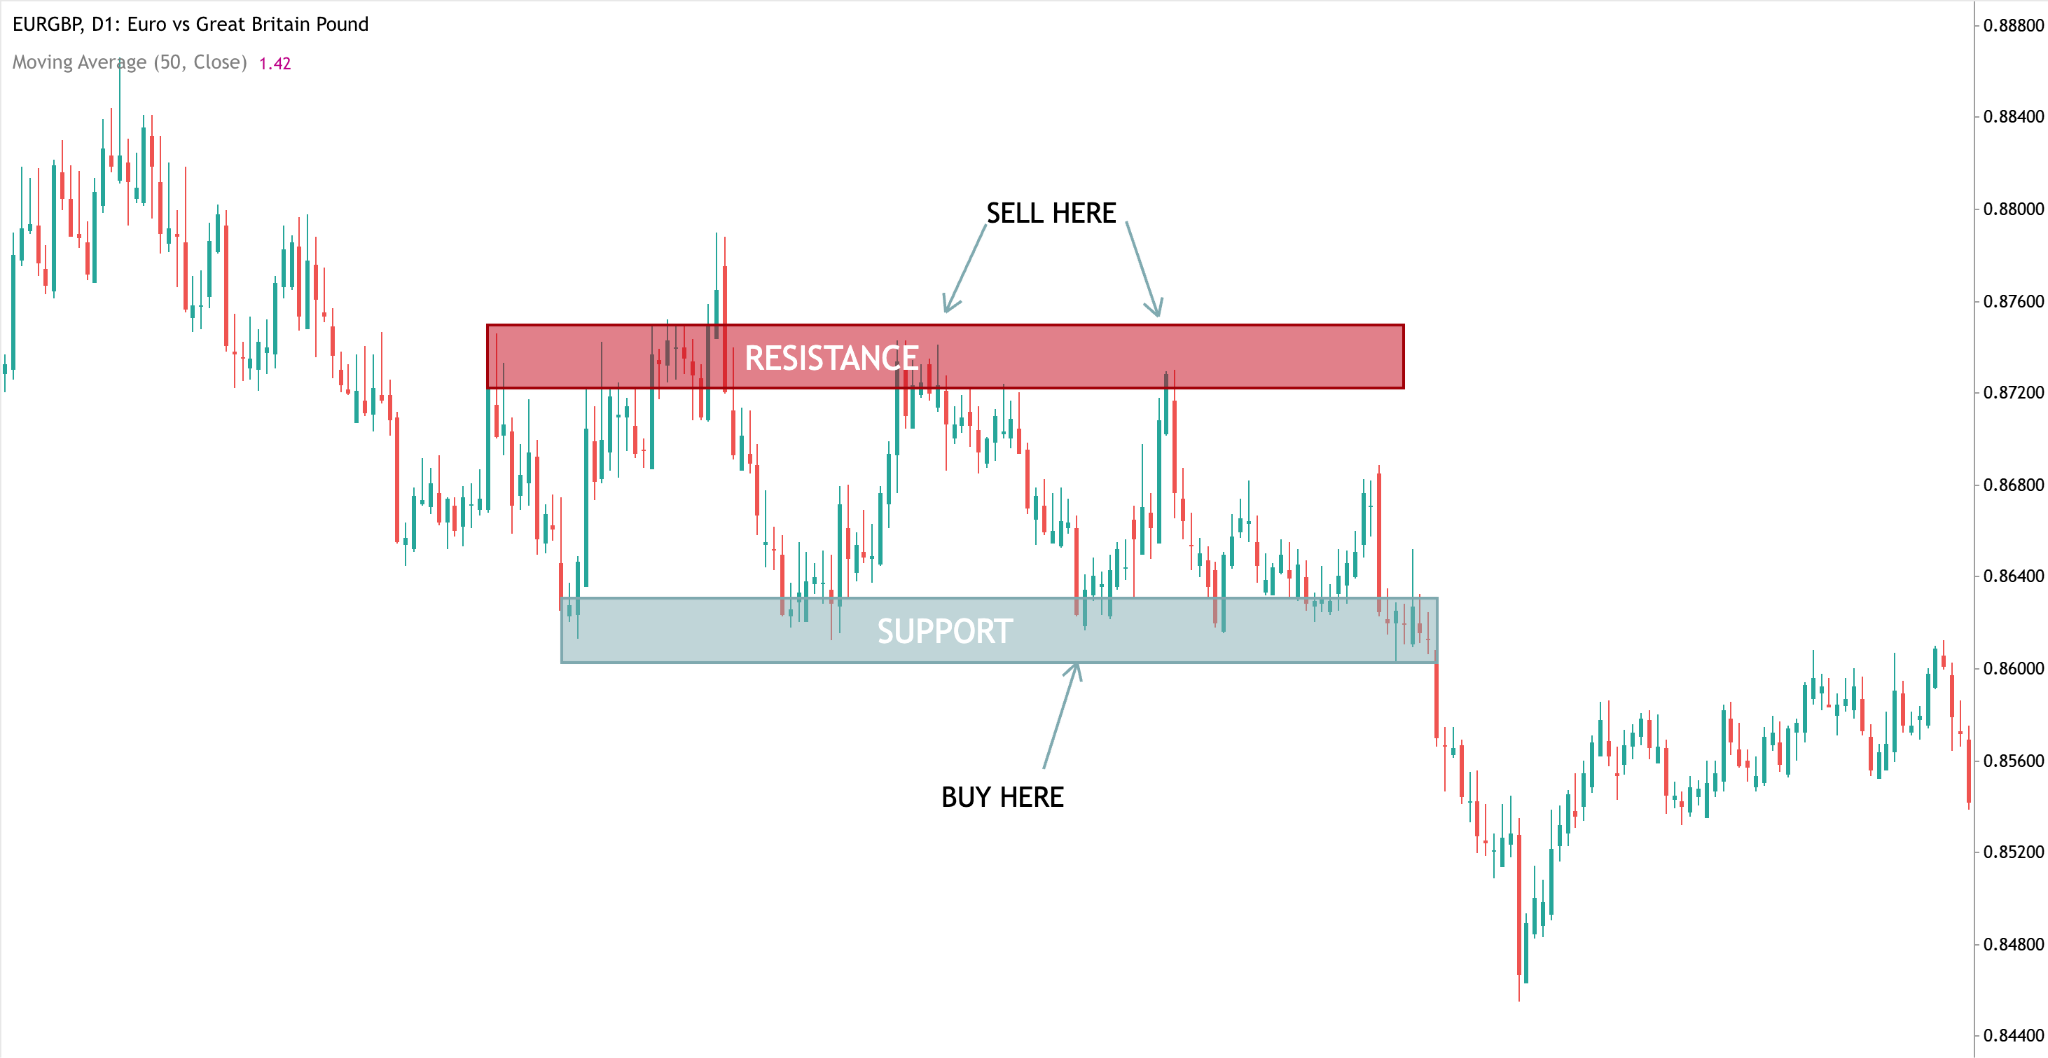
Place stop-loss orders just outside the range boundaries, with a small buffer based on the Average True Range (our ATR calculator helps). Set your target just short of the opposite boundary. A 1:2 risk-reward ratio is a common benchmark for range trades, and it's realistic when you enter near the edge.
2. The RSI Range Strategy
This adds one filter to the bounce: momentum. Price at support tells you where to buy. The relative strength index tells you whether sellers are running out of steam.
How the Strategy Works
Use the standard 14-period RSI. Buy when price is in the support zone and RSI drops below 30, then turns back up. Sell when price is in the resistance zone and RSI rises above 70, then turns back down. Stops go just beyond the zone, and the target is the opposite boundary.
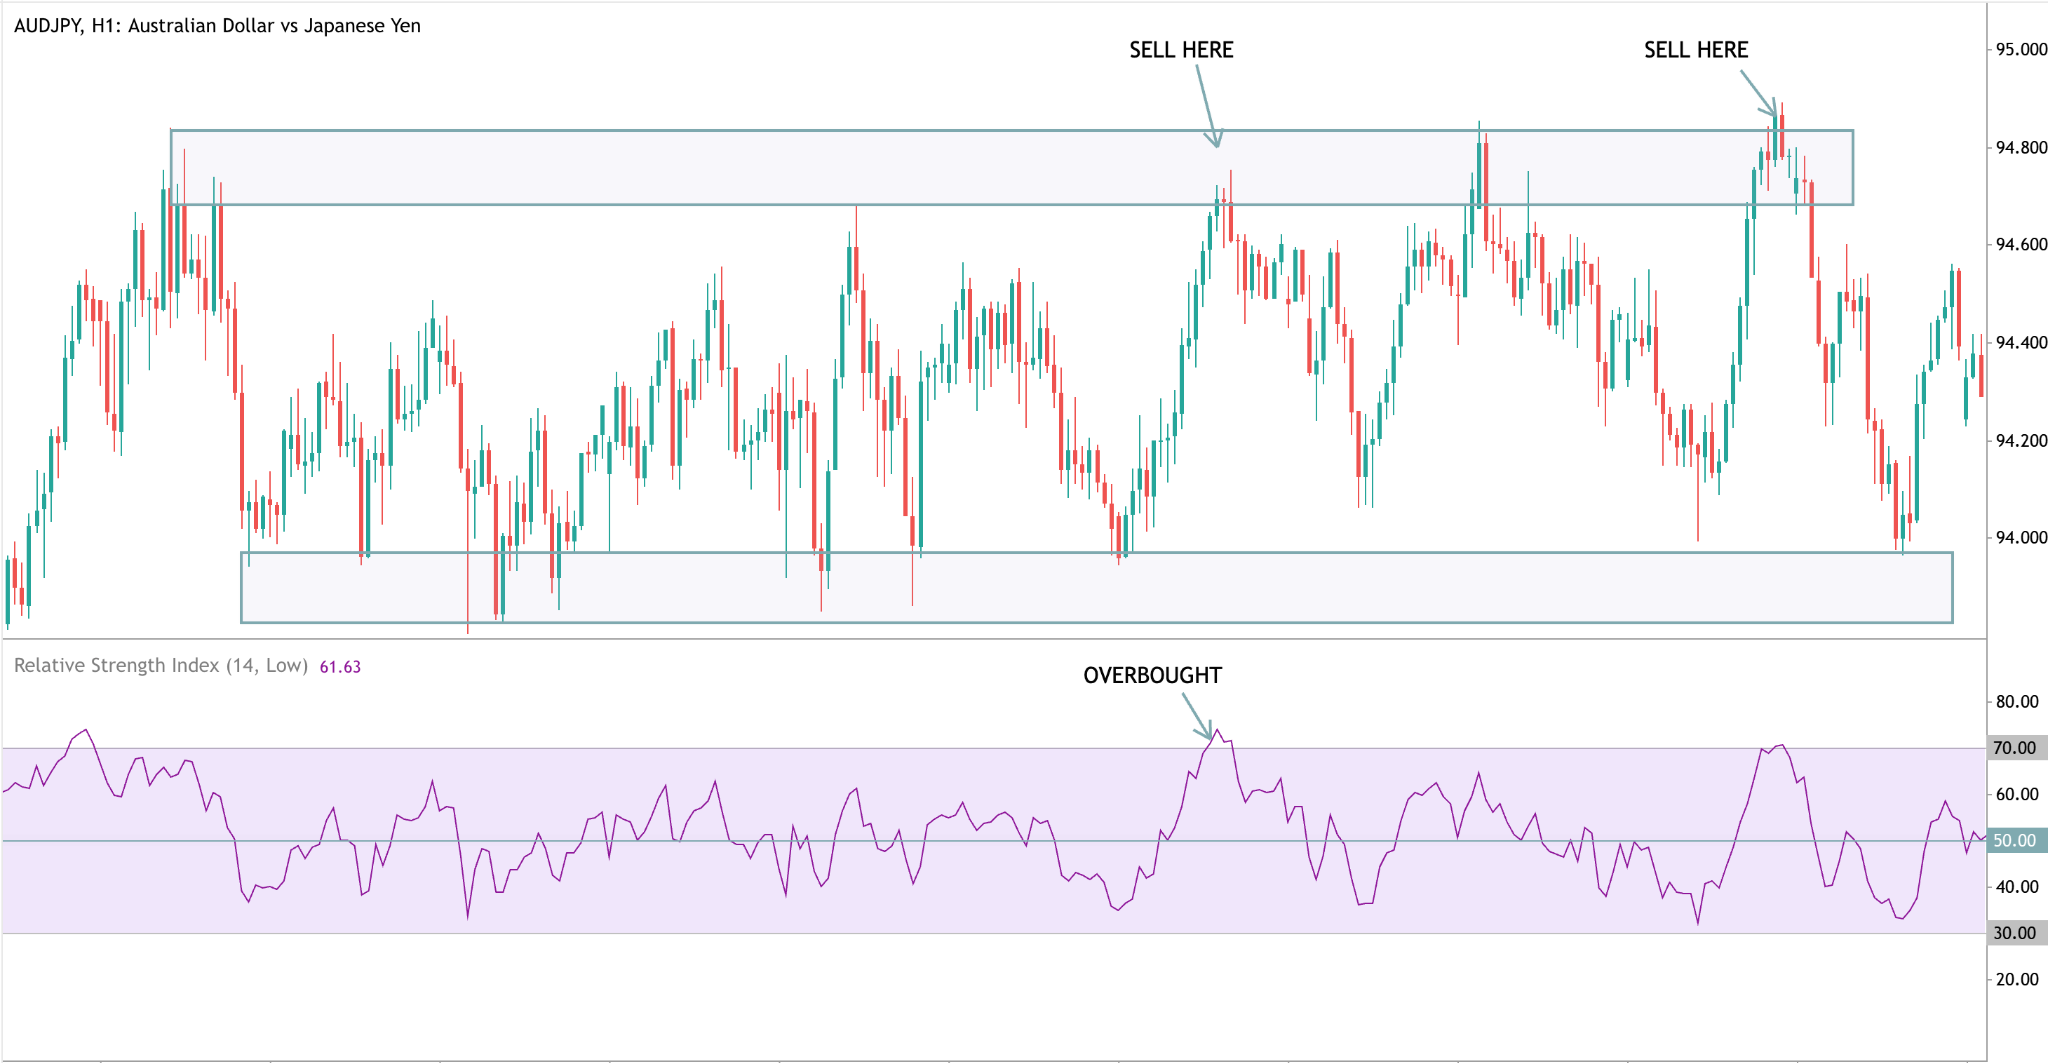
Both conditions matter. In a trend, RSI can sit above 70 for days while price keeps climbing, so an overbought reading on its own is a poor sell signal. Inside a range, momentum keeps running out at the edges, which is exactly when RSI's overbought and oversold readings work.
3. The Bollinger Bands Bounce
Bollinger Bands draw a moving average with a band two standard deviations above and below it. In a quiet market, price tends to bounce between the outer bands like a ball between two walls.
How the Strategy Works
Use the default settings (20, 2) and only trade when the bands are moving sideways. Buy when price touches the lower band, and the next candle closes back inside it. Sell when price touches the upper band and closes back inside. Take partial profit at the middle band and the rest near the opposite band, with your stop just beyond the candle that touched the band.
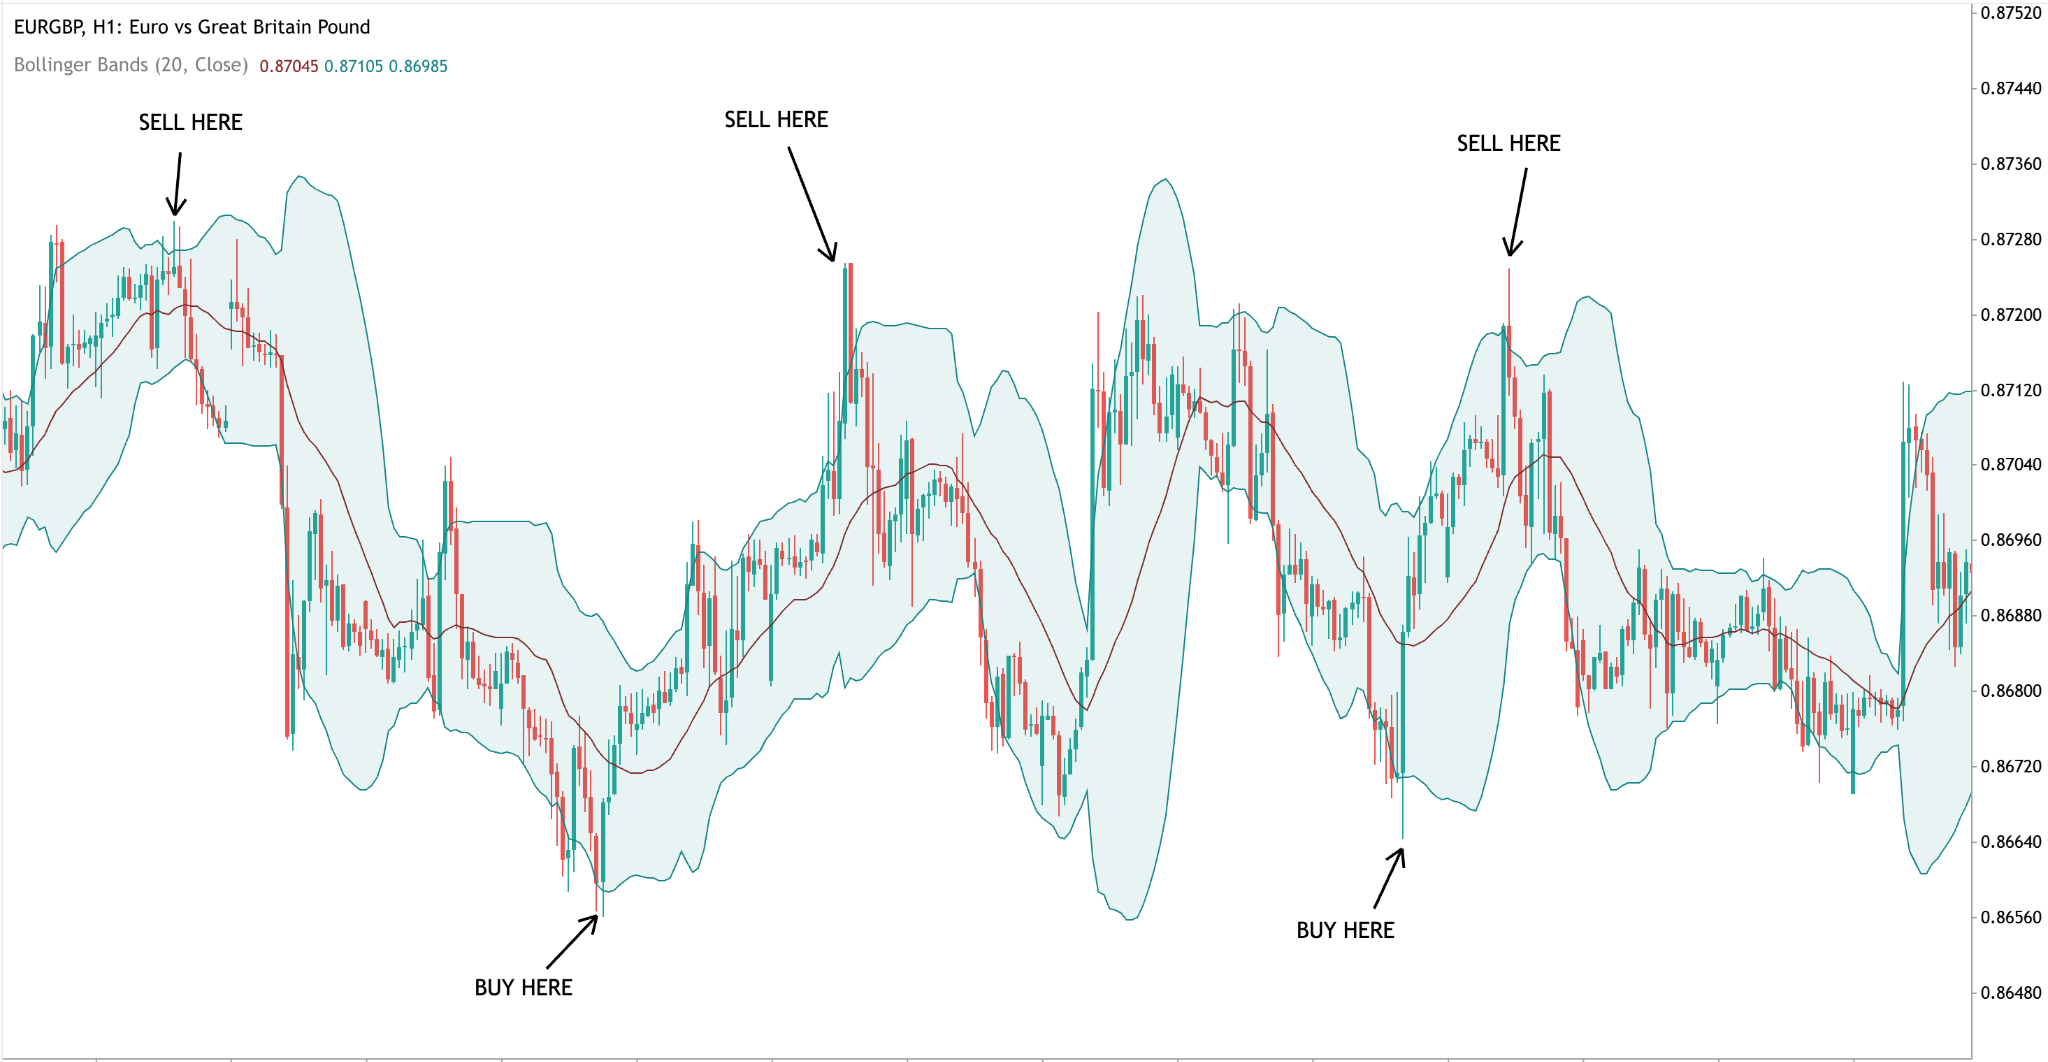
The bands adapt to market volatility, so you don't need to redraw levels every day. That's also the warning sign: when the bands start widening sharply, volatility is rising and a breakout is likely. Stop fading the bands until they flatten again.
4. The Range Breakout Strategy
Every range ends eventually. And always keep this in mind: the longer the range, the stronger the potential breakout. The breakout strategy stops fading the edges and trades the move out of the box instead.
How the Strategy Works
Wait for a candle to close beyond support or resistance, ideally a large candle or a jump in volume. A wick poking through doesn't count. Aggressive traders enter on that close. Conservative traders wait for price to come back and retest the broken level, since old resistance often turns into new support. Place the stop back inside the range, and project the height of the range from the breakout point as your target.
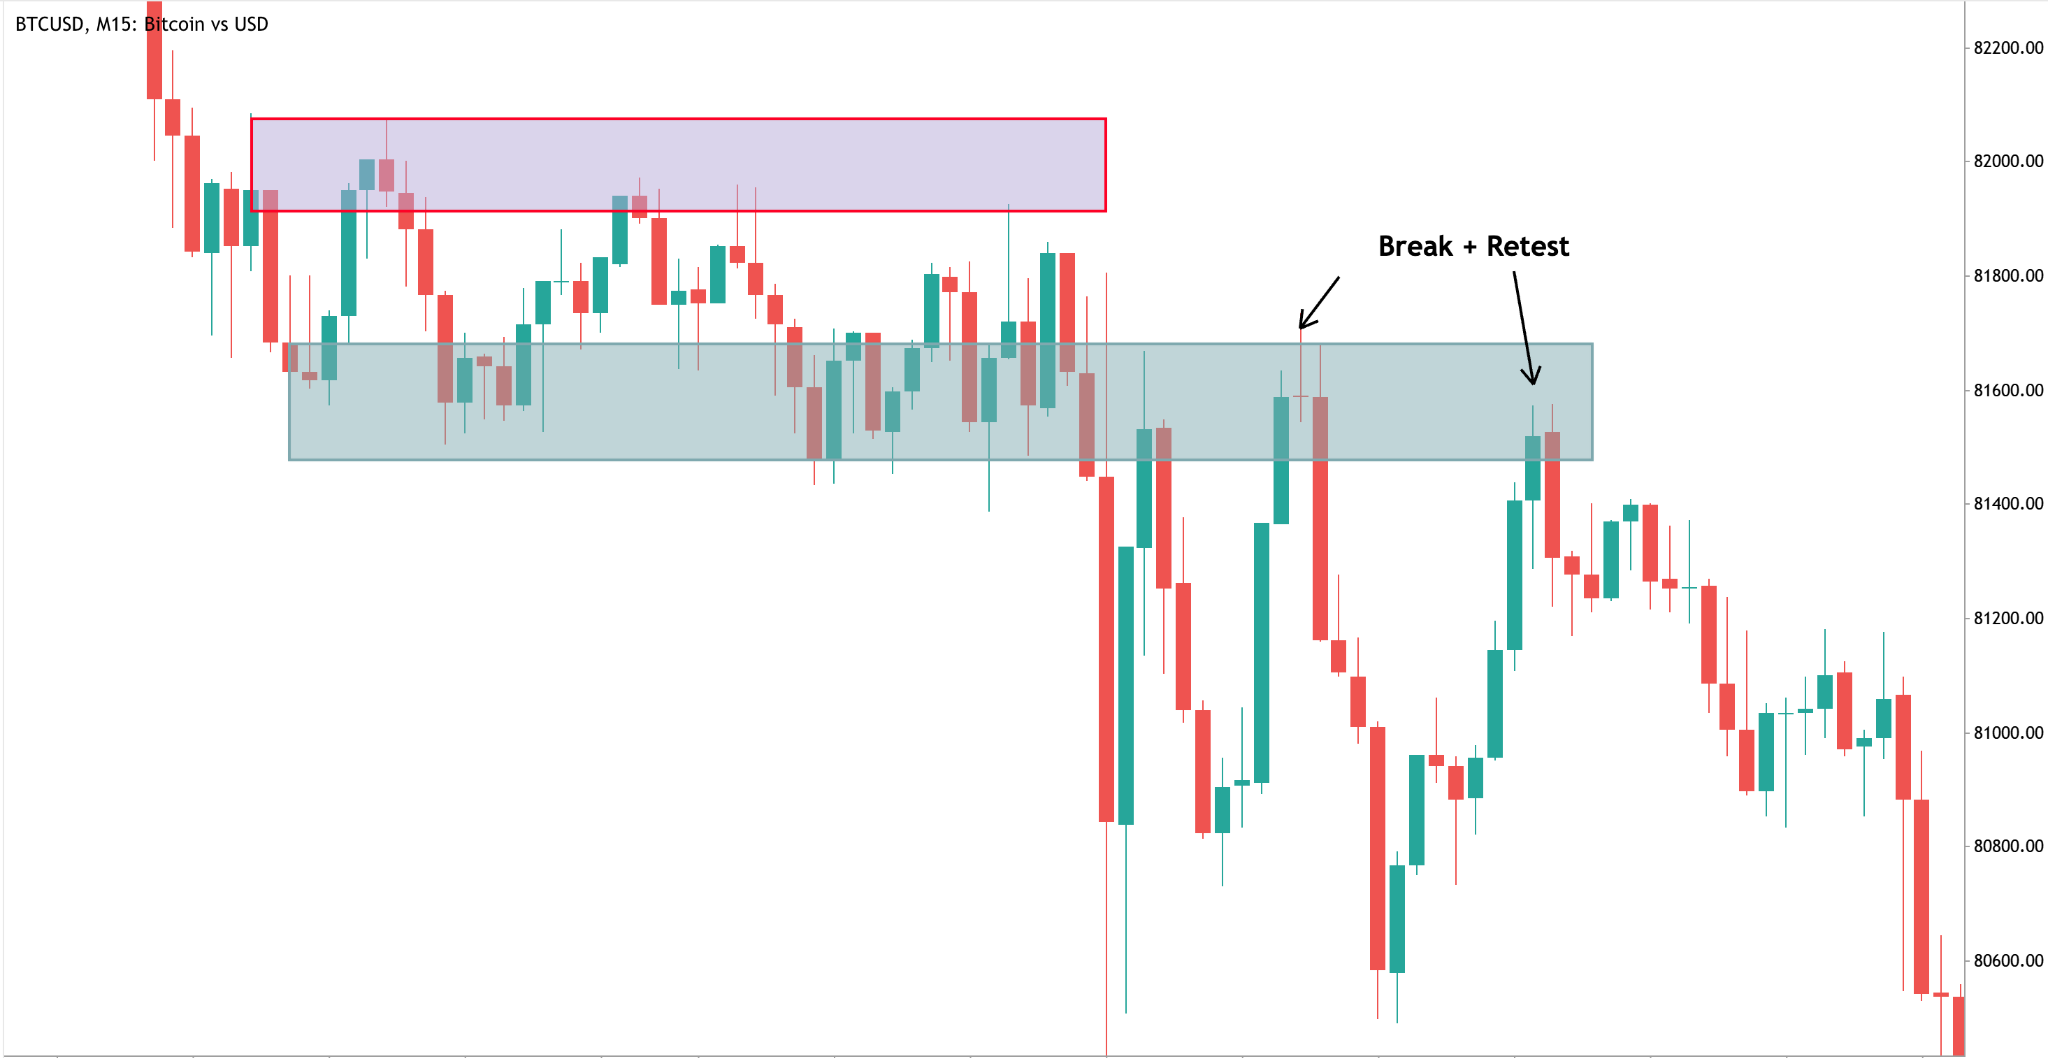
Session-based versions of this setup are popular in forex. The Asian range trading strategy marks the high and low of the quiet Asian session and trades the break at the London open. The Monday range trading strategy uses Monday's high and low as the range for the week. The open range breakout trading strategy trades the break of the first 15 to 30 minutes after the market opens. Our day trading strategies guide covers this last one in more detail.
How to Manage Risk When Range Trading
Range trading can yield smaller, more predictable profits over time. That's the appeal, and also the trap: one unmanaged loss can wipe out weeks of steady gains. Here are some tips on managing your risk while trading in a ranging market:
- Fix your risk per trade. Most traders risk between 0.5% and 2% of their account, depending on risk tolerance and trading experience. Size each position from the distance to your stop. For that purpose, you can use our lot size calculator.
- Always use a stop-loss. Stop-loss orders limit potential losses, and they double as your exit when the range is over. It is also highly advisable to use a trailing stop-loss order, which tracks your position and automatically adjusts your stop-loss rate.
- Set a daily loss limit. Range traders often take multiple trades in a session, and a run of fake breakouts adds up fast. A daily stop loss caps the damage.
- Avoid major news. Economic news such as non-farm payrolls or a central bank decision can blow through an established price range in minutes. Check the economic calendar before every session.
- Count your costs. On a 30-pip target, a 2-pip spread takes almost 7% of the profit before price moves. Liquid instruments with low spreads matter more here than in most strategies.
If you'd rather have these limits enforced automatically, our Risk Manager EA can apply them on MT4 and MT5.
When to Stop Range Trading
Range trading is an excellent method to trade the markets, but much like a trending market, it is a temporary price action event. When a range stops, you need to stop and switch to another strategy instantly.
Traders face the risk of false breakouts in range trading all the time. Price pokes through support, takes out your stop, and snaps straight back inside. Annoying, but survivable. The breakout that turns out to be real is the one that does damage, and only if you ignore your stop. Waiting for a candle close beyond the zone, rather than reacting to a wick, filters out a lot of the noise.
Watch for these signs that a range is losing its grip:
That last one is easy to miss: a range with lower highs forming inside it is often a downtrend in disguise. Each touch also weakens a level, because some of the orders resting there get filled every time price hits it.
When the signs line up, stop thinking like a range trader. A new trend calls for other strategies built around trend lines and pullbacks, which our guide to technical analysis strategies covers. The skill is matching your trading decisions to the market conditions in front of you.
Pros and Cons of Range Trading
Range trading isn’t right for every trader or every market. Before you commit to it, weigh what it does well against where it tends to let traders down.
- Clear entry and exit points at levels you can see on the chart
- Defined risk, with stops sitting just outside the range
- Frequent setups while the market stays balanced
- A versatile strategy across various markets; in the stock market, stock screeners can find low-ADX names in minutes
- Limited profit potential, since each trade is capped by the width of the range
- False breakouts can stop you out before price returns
- Real breakouts cause large losses if stops aren't respected
- Trading costs eat a bigger share of small targets
So, is range trading profitable? It can be, but it pays out differently from trend trading. You give up the big win for consistent patterns and defined risk, and over time those small, profitable trades can add up. If it’s something you may want to try out, start with paper trading on a demo account and log every trade in our free trading journal template before you go live.
Wrapping Up
Trend traders spend most of their time waiting for a clear direction. Range traders, on the other hand, look for opportunities in the back-and-forth price action that often fills the gaps between major trends. That's the real value of this strategy: it gives you a structured way to trade during quieter market conditions instead of forcing trades or chasing price movements. Identify a clear range, look for repeated bounces from support and resistance, and make sure there's enough room between the boundaries to offer a worthwhile opportunity.
Of course, not every range lasts forever. Markets eventually break out, and a strategy that works in sideways conditions can quickly become ineffective when a strong trend emerges. Keep your stops just outside the range boundaries, manage your risk, and be ready to step aside when the structure breaks. The goal isn't to trade every move, but to recognize the right conditions and make them work in your favor.
FAQs
Still weighing whether range trading fits your style? Here are quick answers to the questions traders ask most.
What is the best range trading strategy?
There's no single best range trading strategy. The support and resistance bounce is the best starting point for most traders because it's simple and the risk is clearly defined.
Does range trading work in forex?
Yes. Many currency pairs spend long periods moving sideways, especially during the Asian session. A forex range trading strategy usually focuses on liquid pairs with tight spreads, since targets are smaller than in trend trading.
Which indicators work best for range trading?
RSI, Bollinger Bands, pivot points, ADX, and moving averages are the most common range trading indicators. ADX below 20 confirms a non-trending market, while RSI below 30 or above 70 near the range edges helps time entries.
Risk Disclosure: The information provided in this article is not intended to give financial advice, recommend investments, guarantee profits, or shield you from losses. Our content is only for informational purposes and to help you understand the risks and complexity of these markets by providing objective analysis. Before trading, carefully consider your experience, financial goals, and risk tolerance. Trading involves significant potential for financial loss and isn't suitable for everyone.