Moving Averages in Trading: The Complete Guide
- What Is a Moving Average
- What Is an Exponential Moving Average?
- SMA vs EMA: Key Differences
- Other Types of Moving Averages
- How to Use Moving Averages
- Best Moving Averages by Timeframe and Trading Style
- Top Moving Average Strategies
- Combining Moving Averages With Other Technical Indicators
- How to Add Moving Averages on MT4 and MT5
- Where Moving Averages Can Mislead You
- Final Thoughts
- FAQs
Open almost any trading chart, and you'll find at least one moving average running through the candles. It is one of the oldest tools in technical analysis and still one of the most widely used, because it answers a simple question: once you strip out the noise, which way is this market actually moving?
This guide covers moving averages in trading from the beginning. You'll learn how the simple moving average and the exponential moving average are calculated, how they differ, which settings suit scalpers, day traders, swing traders, and long-term investors, and how to trade the most popular moving average strategies, from the golden cross to the 8/13/21 EMA setup.
What Is a Moving Average
A moving average is a technical indicator that calculates an asset's average price over a set number of periods and plots the result as a single line on the chart. Each time a new candle closes, the oldest price drops out of the calculation, and the newest one is added. The average moves with the market, which is where the name comes from.
The whole point is to smooth out price fluctuations. Raw price data is messy. A currency pair, for example, can swing up and down dozens of times in one session and finish roughly where it started. By averaging those swings, a moving average filters out market noise and shows a clearer trend, so you can base decisions on the bigger picture rather than on the last few candles.
Moving averages work on any instrument with price data: forex pairs, a stock, an index, gold, oil, or crypto. The maths doesn't care what the security is, which is one reason the tool is so popular across various markets. On a chart, a simple moving average looks like this:
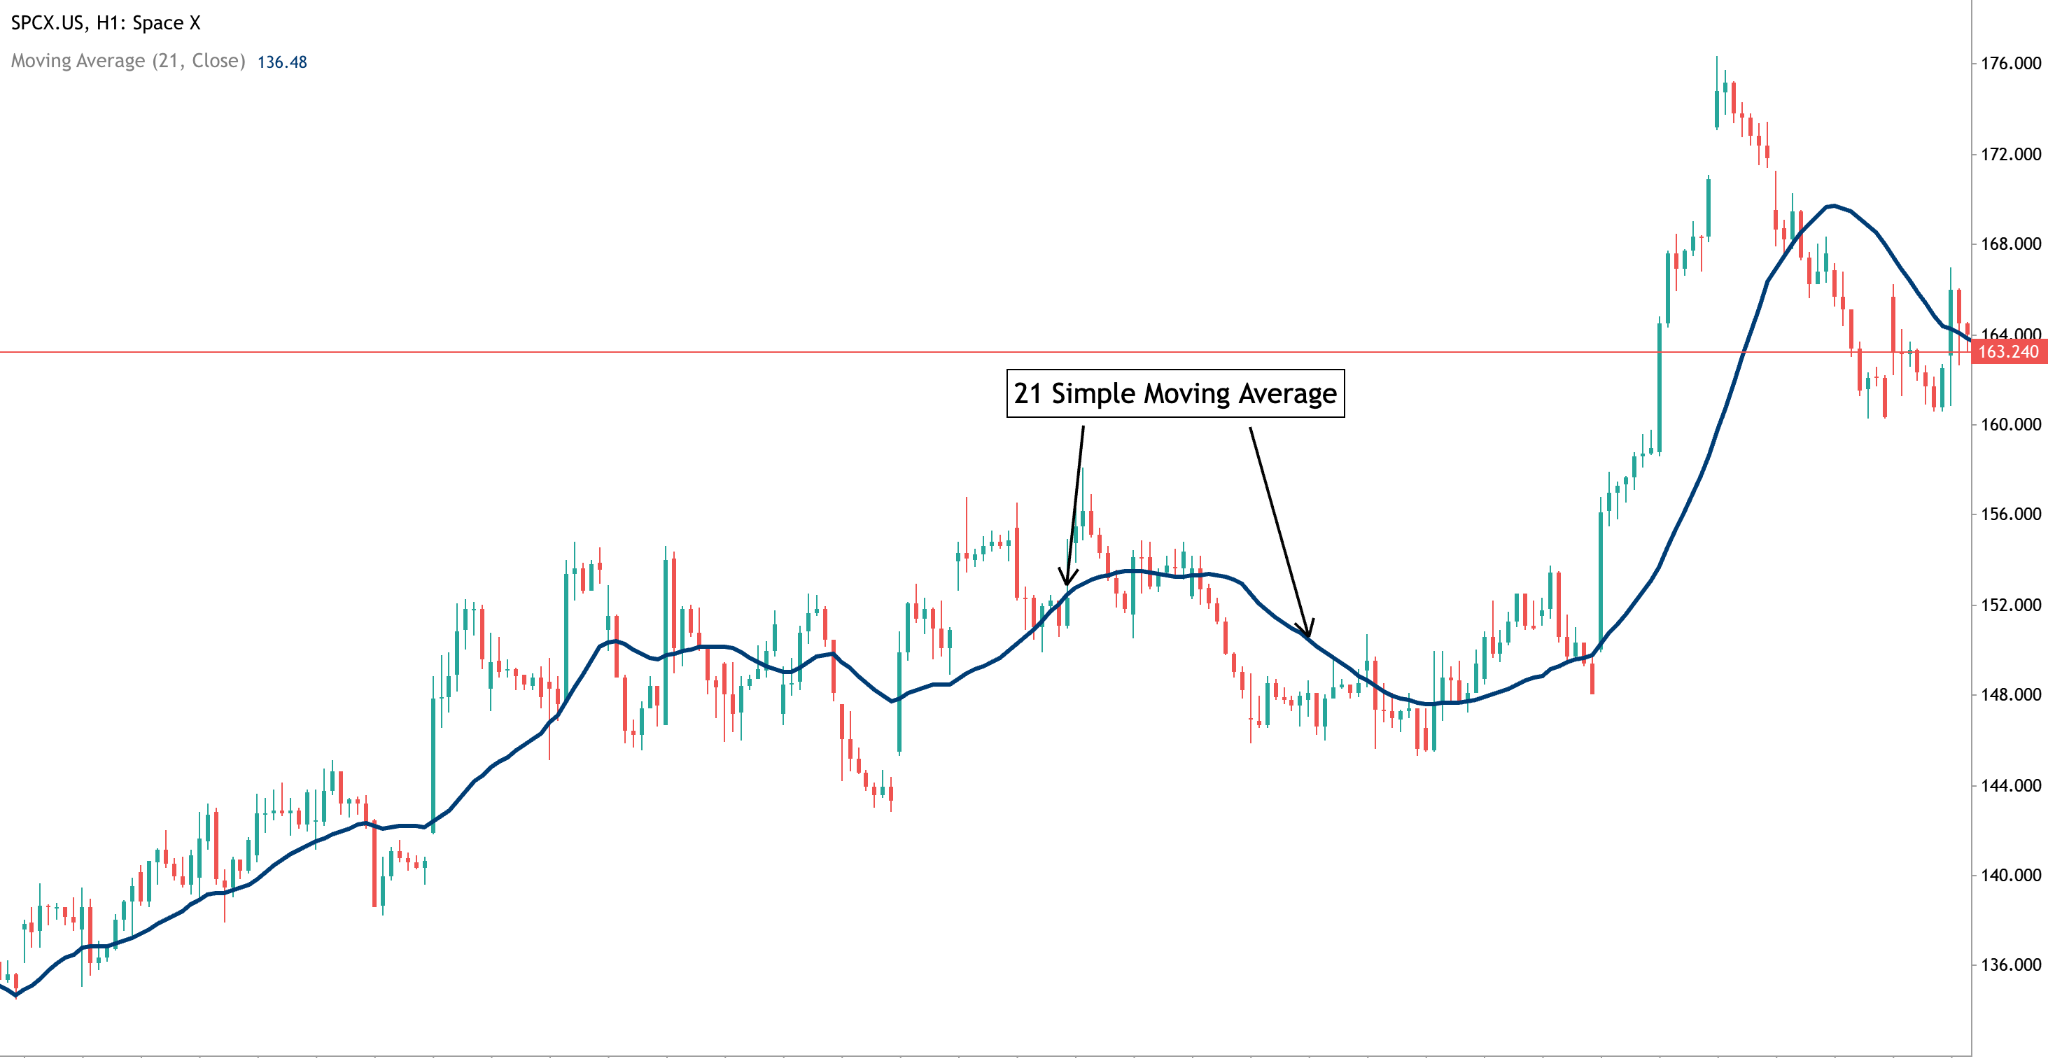
How a Simple Moving Average Is Calculated
The simple moving average (SMA) is calculated by averaging the last N closing prices. You add up the closes for the period and divide by the number of periods:
SMA = (P1 + P2 + … + PN) ÷ N
Here is an example using a 5-period SMA on five EUR/USD daily closes: 1.1000, 1.1020, 1.1010, 1.1040, and 1.1030. The sum is 5.5100, and 5.5100 ÷ 5 = 1.1020. That's today's SMA value.
Tomorrow EUR/USD closes at 1.1060. The oldest close (1.1000) drops out, the new one comes in, and the average becomes (1.1020 + 1.1010 + 1.1040 + 1.1030 + 1.1060) ÷ 5 = 1.1032. Plot each value and connect the dots, and you have the SMA line.
Most platforms use the closing price by default for the daily timeframe, because the close is where the market settles each period. You can also base the calculation on the open, high, low, or median price if your method calls for it. But keep in mind that moving averages can be calculated for any timeframes - from the shorter one to the longest one.
Why Moving Averages Lag Price
Because a moving average is built from historical data, it always trails the current price. Moving averages are lagging indicators that signal after trends begin, not before. The longer the period, the more past data points go into the calculation and the bigger the lag. A 200-period average can take weeks to respond to a turn that a 10-period average picks up in a few days.
This is the central trade-off. Short-term moving averages are more responsive, while long-term moving averages are slower to react. A fast average hugs price and catches trend changes early, but it also gets pulled around by every spike. A slow average ignores most of the noise but tells you about a new trend late. Picking a period is really a decision about how much delay you'll accept in exchange for fewer false signals.
What Is an Exponential Moving Average?
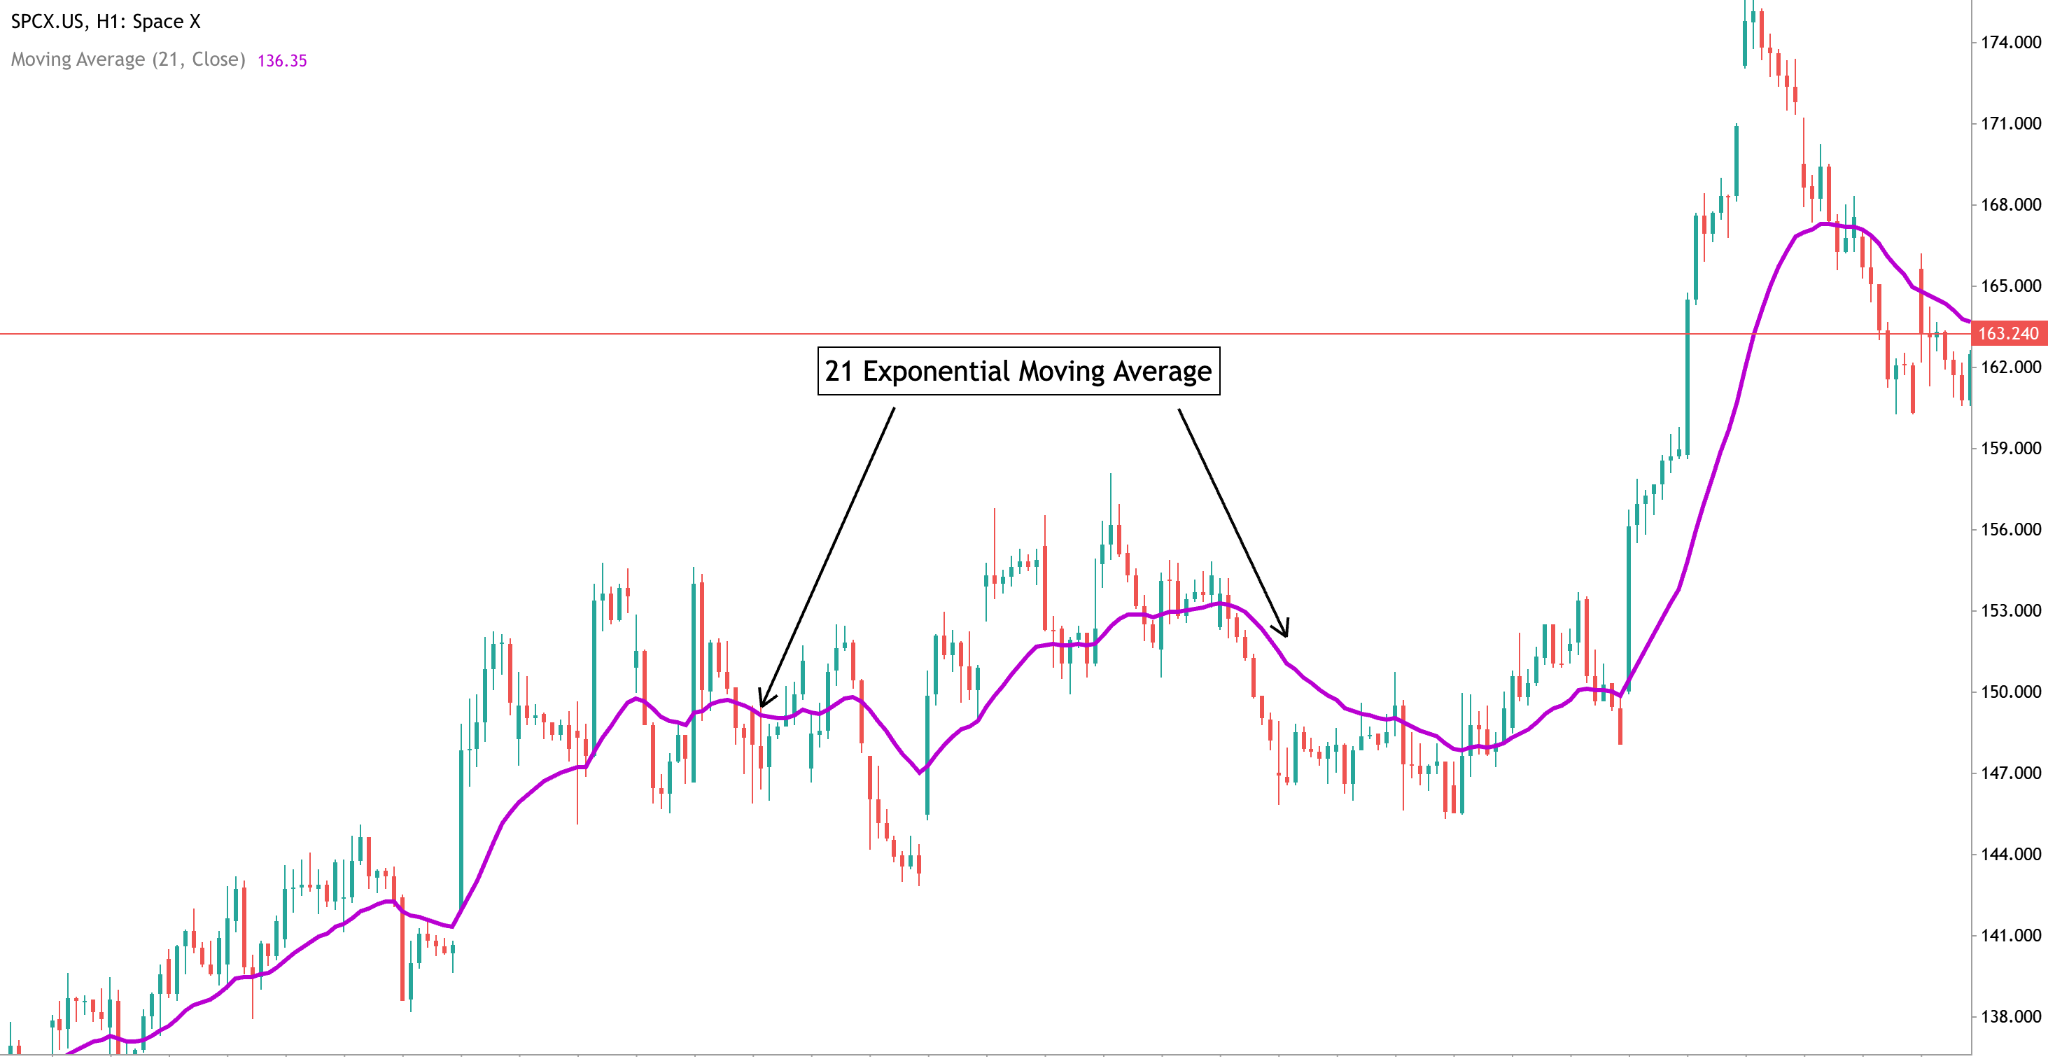
The exponential moving average (EMA) is a moving average that gives more weight to recent prices. For comparison, the SMA treats a close from 20 days ago exactly the same as yesterday's close. The EMA, on the other hand, lets the newest prices have the biggest say, and older prices fade out gradually instead of dropping off all at once.
The practical result is that the EMA reacts faster to price changes. When a market turns, an EMA bends toward the new direction sooner than an SMA of the same length. That speed is why most short-term traders reach for the EMA first.
How the EMA Is Calculated
The EMA takes three steps:
- Calculate an SMA for the first N periods. This becomes the starting EMA value.
- Work out the weighting multiplier: 2 ÷ (N + 1).
- For every new candle, apply: EMA = (Close − Previous EMA) × Multiplier + Previous EMA.
For a 10-period EMA, the multiplier is 2 ÷ 11 = 0.1818, so the latest close makes up about 18% of the new value. For a 50-period EMA, the multiplier drops to 2 ÷ 51, or roughly 3.9%, which is why longer EMAs move so much more calmly.
Say the previous 10-period EMA on EUR/USD was 1.1020 and today's close is 1.1060. The new EMA is (1.1060 − 1.1020) × 0.1818 + 1.1020 = 1.1027. Your platform does this for you, but knowing the weighting explains why a 10 EMA whips around while a 200 EMA barely twitches.
SMA vs EMA: Key Differences
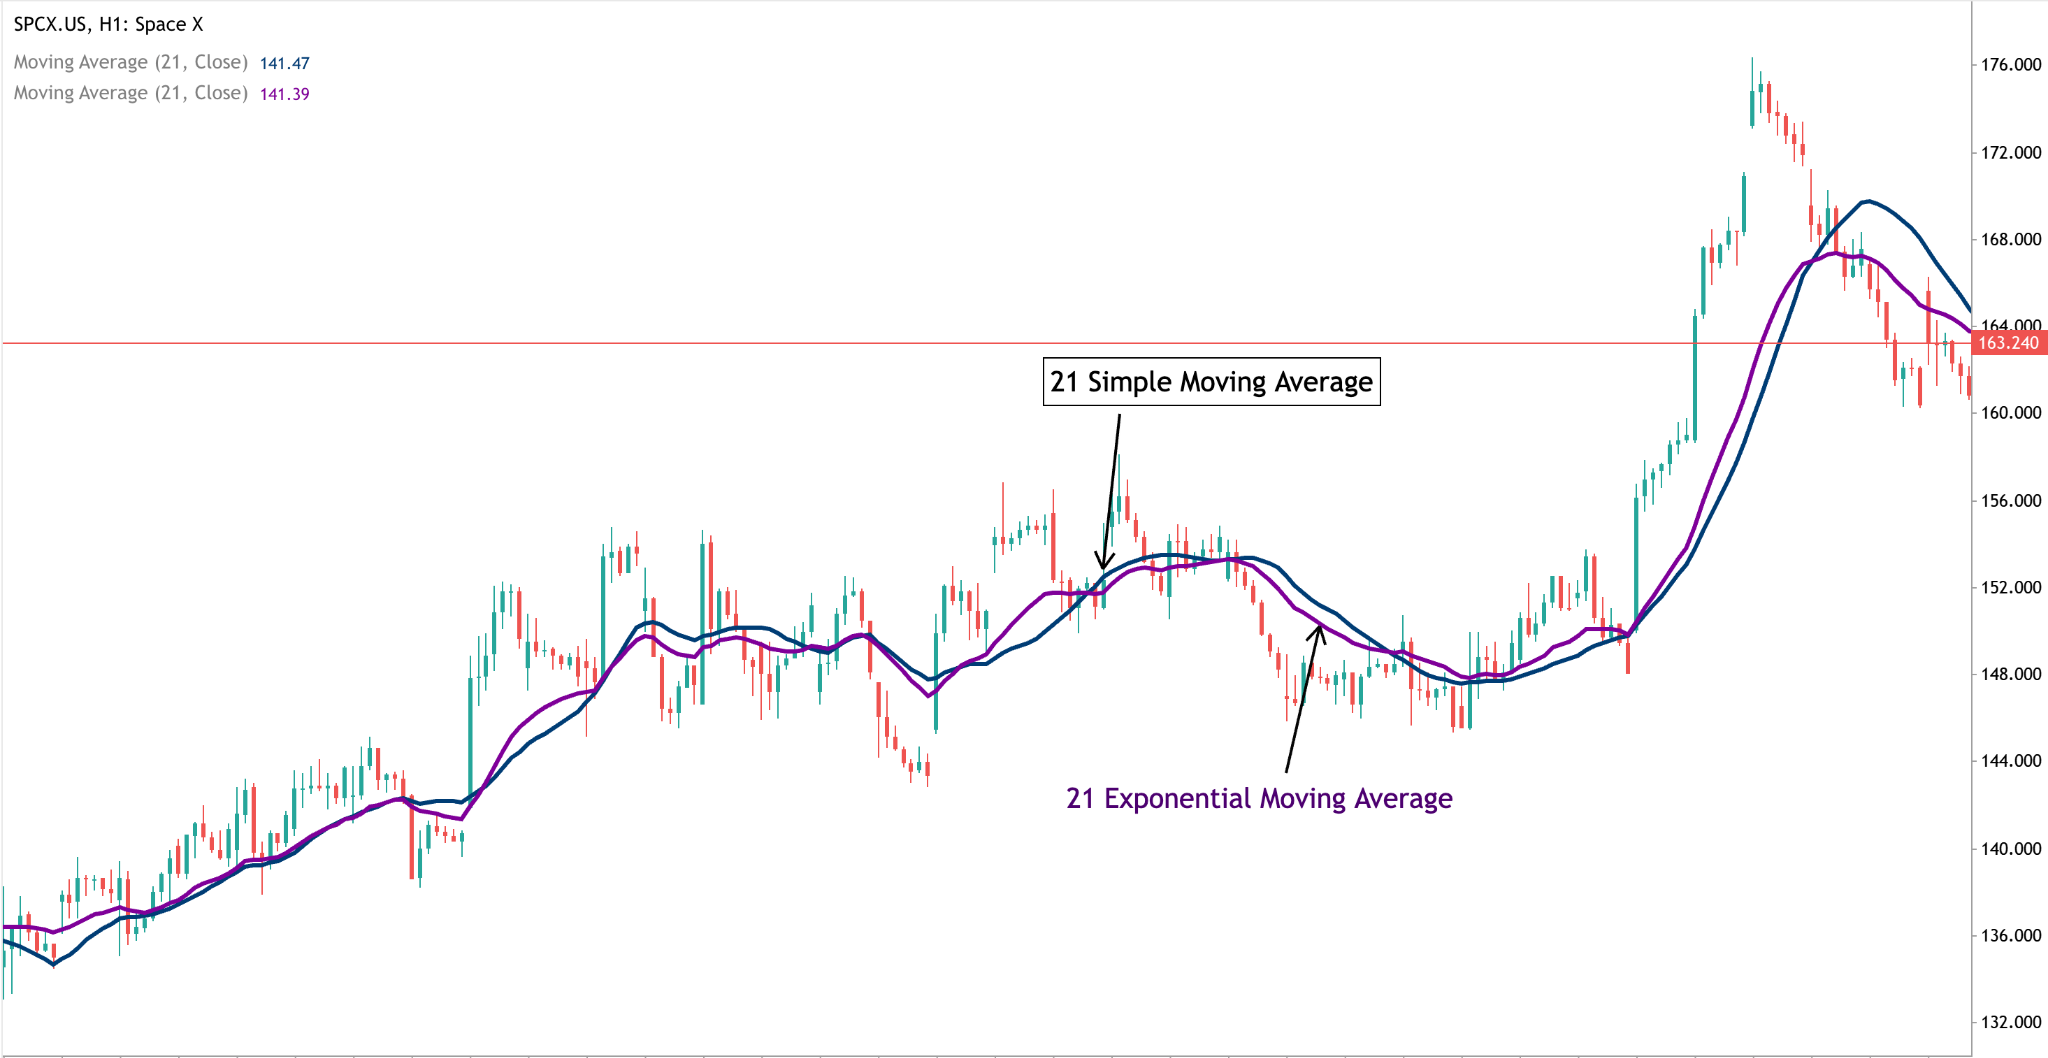
Both lines measure the average price over a given period. The difference is how they treat older data, and that changes how they behave on a chart.
Here are the key differences between SMA and EMA:
As you can see, the SMA's main weakness is that it gives every data point in the period equal weight. A price from 50 sessions ago, set under completely different market conditions, counts as much as today's. There's also a drop-off effect: when a big spike leaves the calculation window, the SMA can jump even though nothing happened in the market that day.
The EMA reduces that lag, but it pays for it. Because it reacts faster, it's more easily fooled by one-off spikes and tends to cross back and forth more often when price is going sideways.
So which is better? Neither, in absolute terms. Many traders use both: an SMA for the big picture and an EMA for timing. The 200-day SMA is the classic long-term reference, while the 50-day EMA is a common reference for intermediate trends. Investors who hold for months tend to lean on SMAs; traders who hold for minutes or hours tend to prefer EMAs.
Other Types of Moving Averages
The SMA and EMA cover most use cases, but several other variations exist, and some of them appear inside well-known indicators.
Weighted Moving Average (WMA)
The WMA assigns weights on a straight-line scale. In a 5-period WMA, the latest close is multiplied by 5, the one before by 4, and so on down to 1, and the total is divided by 15 (the sum of the weights). It sits between the SMA and EMA in responsiveness.
Triangular Moving Average (TMA)
The triangular moving average (TMA) is an average of previous SMA values. In effect, it's an SMA of an SMA, which puts most of the weight on the middle of the period. The result is a very smooth line, but the TMA reacts slowly to price changes, which can delay signals. It's better at showing the dominant swing than at timing entries.
Best for: traders who want to react quickly to recent price movements while still smoothing out short-term fluctuations. It gives more weight to the latest prices and less weight to older ones.
Smoothed Moving Average (SMMA)
The SMMA works like an EMA with a very long memory: every past price keeps a small influence. It's the averaging method behind Wilder's RSI and the lines of Bill Williams' Alligator indicator.
Best for: identifying the overall market trend while filtering out short-term price fluctuations. It smooths price data more gradually than many other moving averages, making it useful for traders who want a clearer view of the underlying trend.
Hull Moving Average (HMA)
Developed by Alan Hull, the HMA combines weighted moving averages with a square-root period to cut lag while keeping the line smooth. It's popular with short-term traders who find the EMA too noisy and the SMA too slow.
Best for: identifying market trends and potential trend reversals with less lag than many traditional moving averages. It combines weighted moving averages to respond quickly to price changes while keeping the line relatively smooth.
Volume-Weighted Moving Average (VWMA)
The VWMA weights each closing price by the volume traded in that period, so high-volume sessions count more. It blends a trend tool with a volume indicator. When the VWMA sits above the SMA of the same length, it suggests that rallies are happening on heavier volume than declines.
Best for: identifying trends while accounting for trading volume. It gives more weight to prices during periods of higher trading activity, helping traders see whether a price move is supported by stronger market participation.
How to Use Moving Averages
A moving average is just a line on a chart. The big question is: how should you use it? What makes it useful and how should you read it? To help you get started, here are the five main ways traders put moving averages to work.
Identify Trend Direction
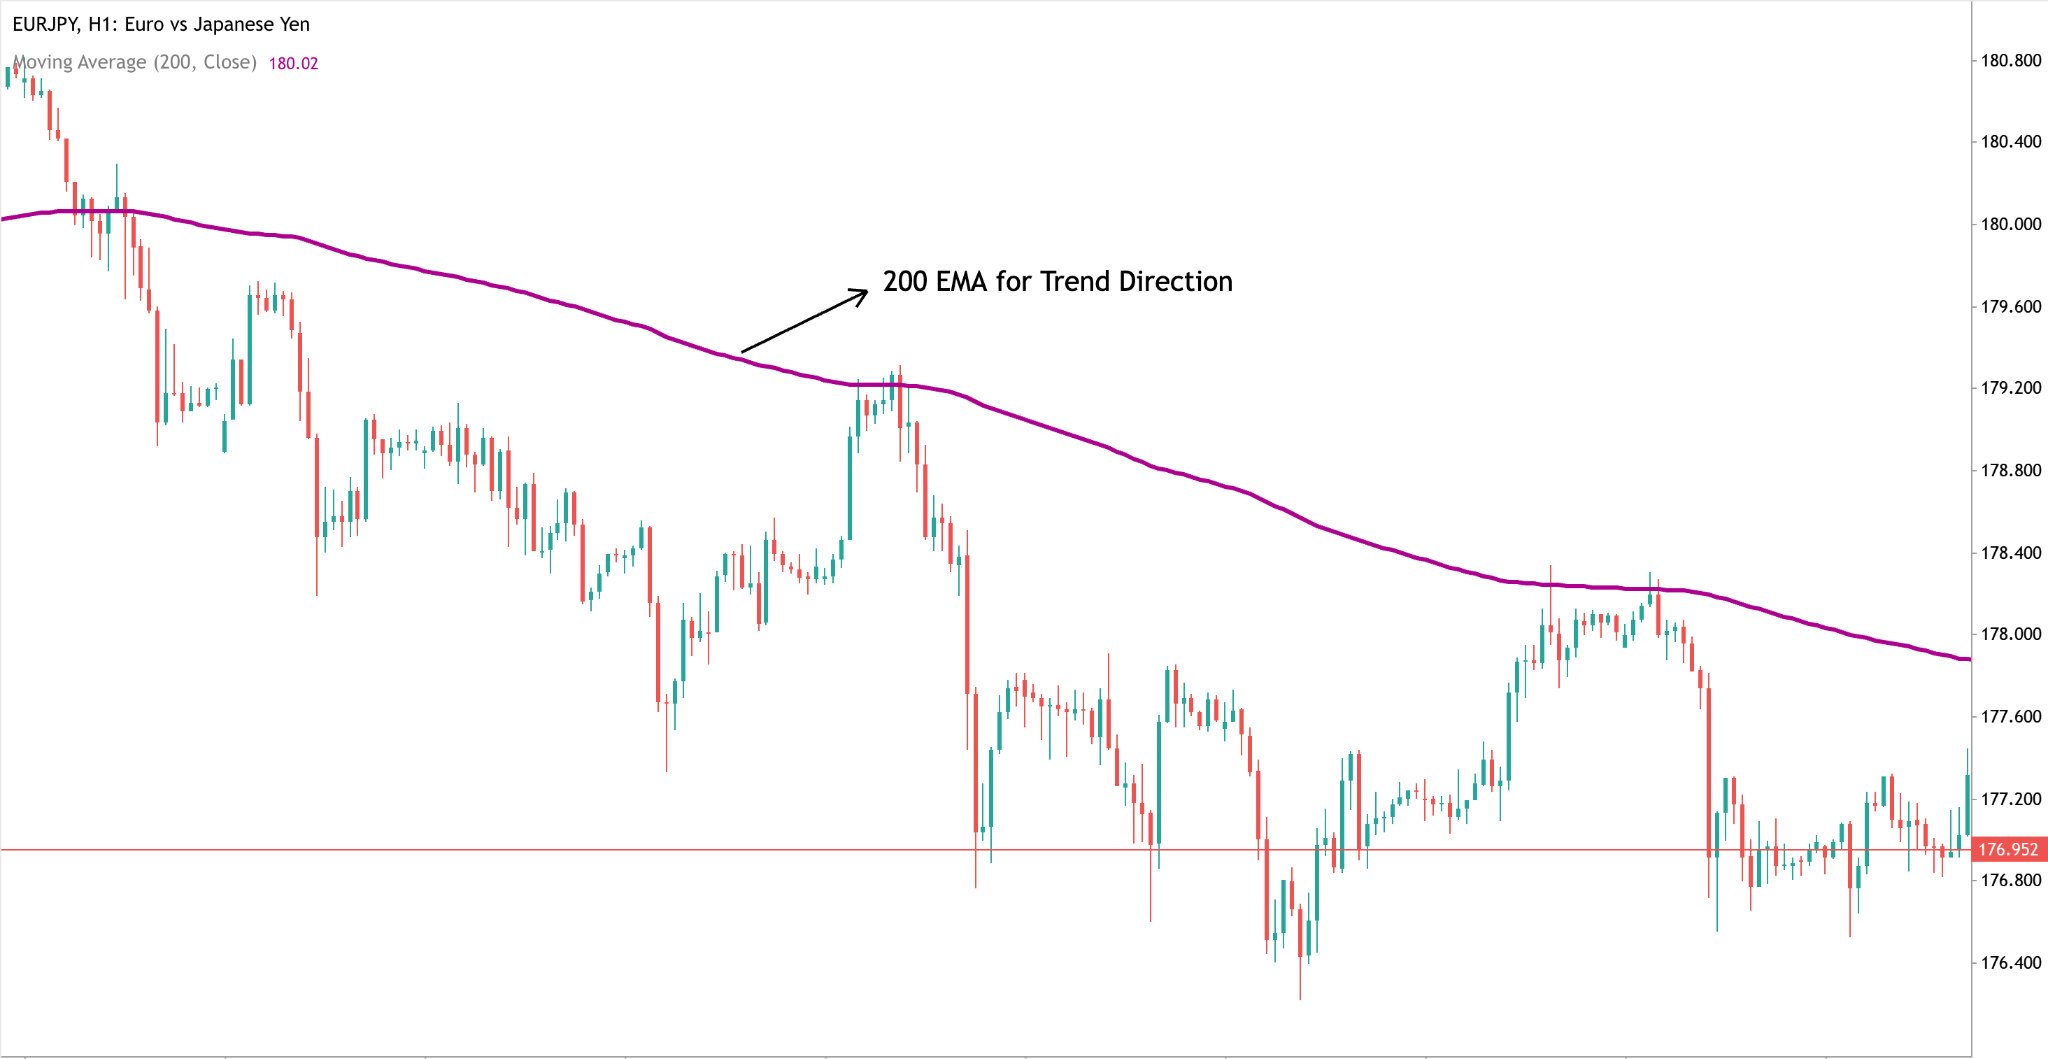
This is the simplest and most important use. When prices consistently remain above a rising moving average, it indicates an upward trend. Prices below a declining moving average suggest a downward trend. When the average is flat and price keeps crossing back and forth through it, the market is in a range, and there's no trend to follow.
Slope matters as much as position. A steep average points to a strong uptrend or downtrend. A trend rarely changes direction without the average flattening first, so a line that starts to level off is often the first hint of a possible reversal. Many traders use a long average as a simple filter: look only for buys when price is above the 200-period average, and only for sells when it's below.
Use Moving Averages as Dynamic Support and Resistance
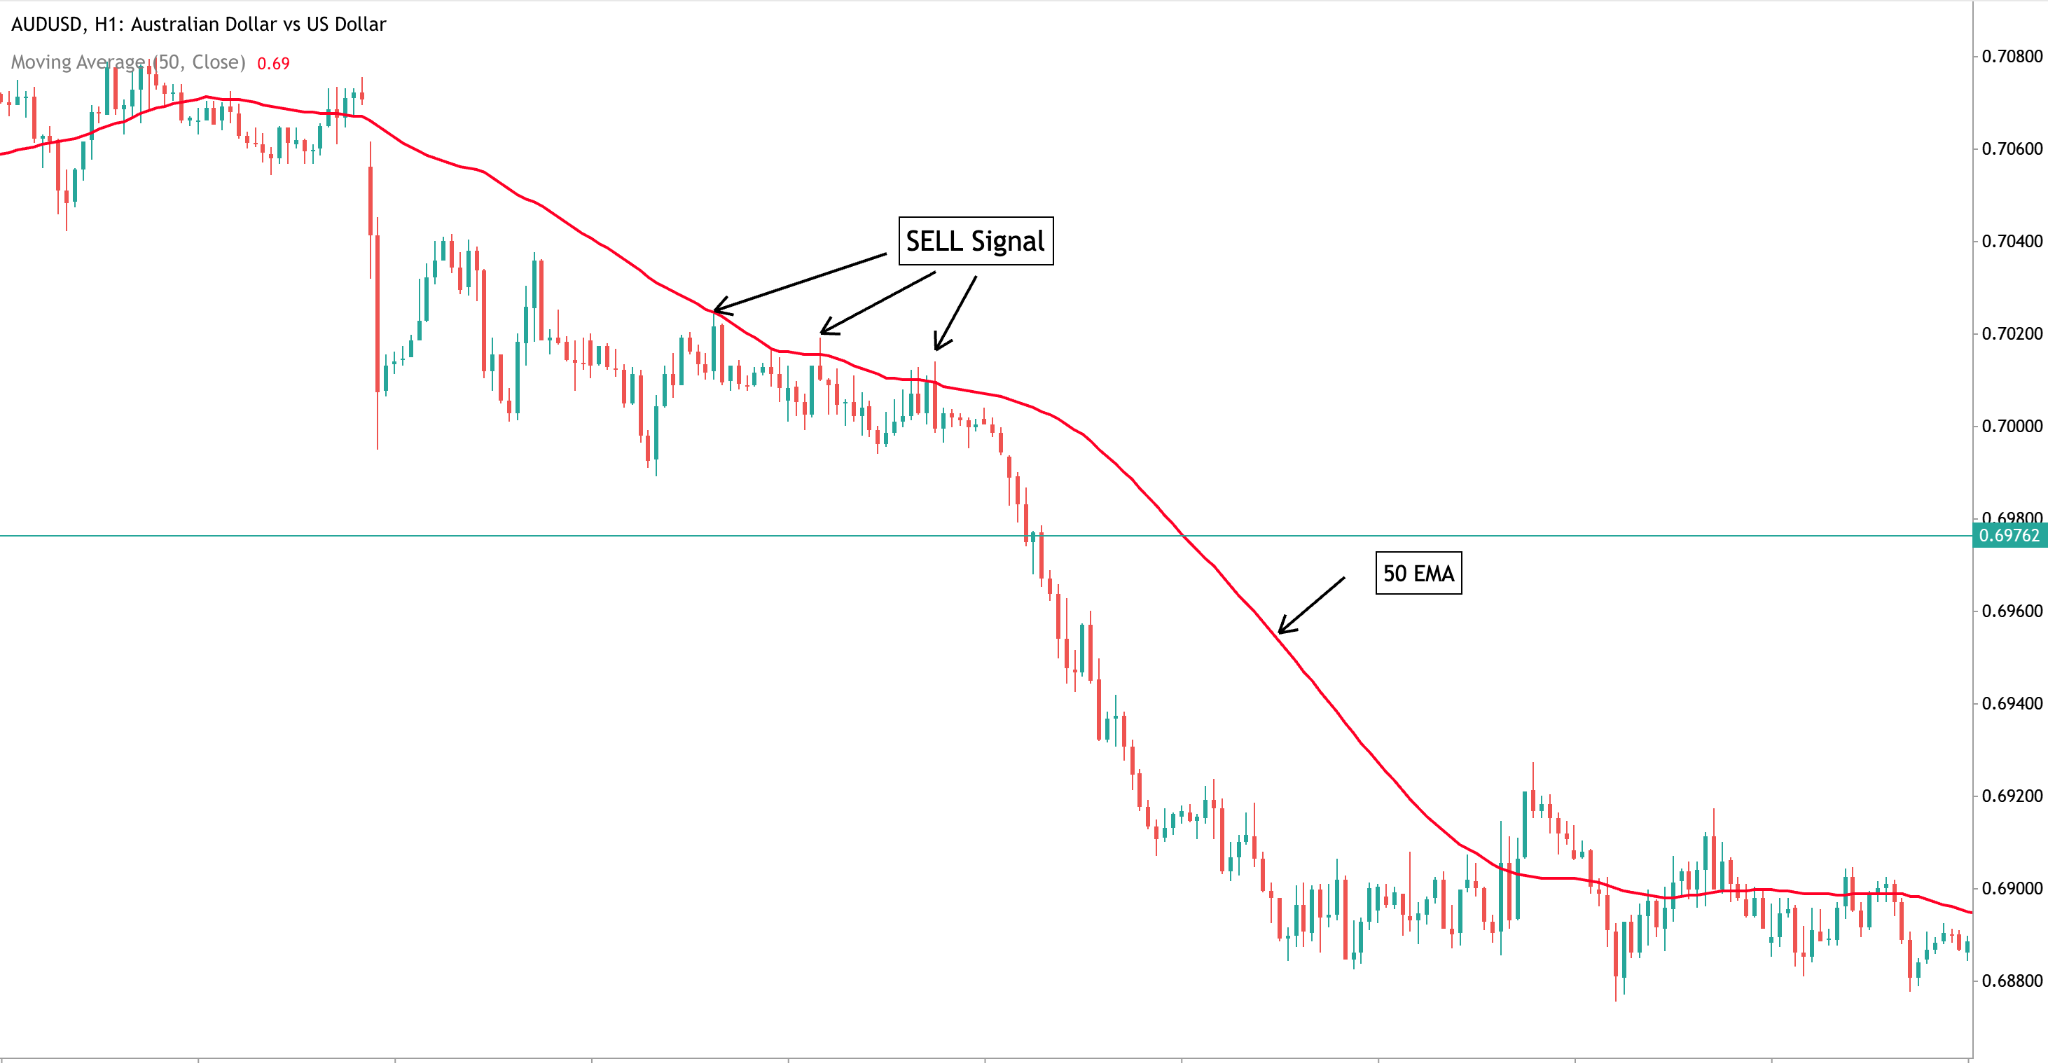
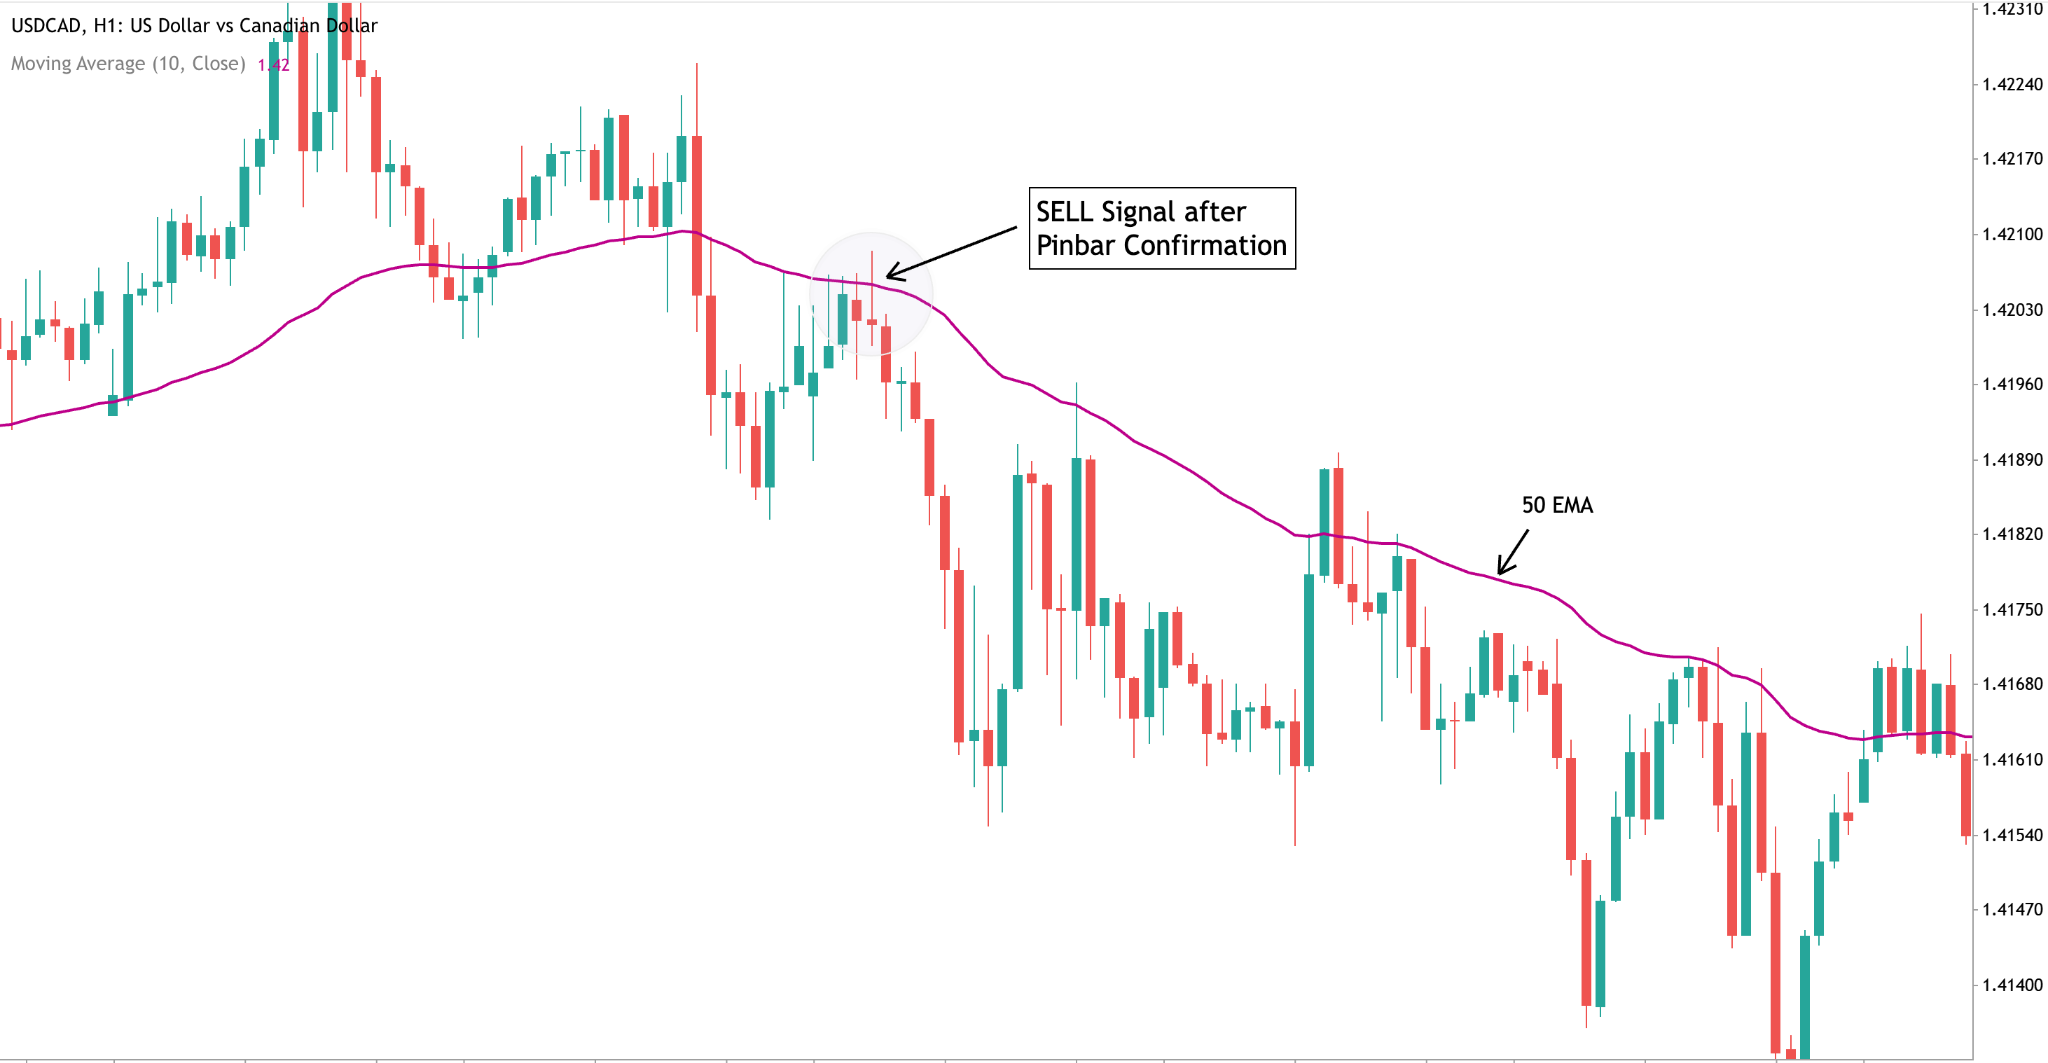
Horizontal support and resistance levels stay put. Moving averages move with price, which is why traders call them dynamic support and resistance. In a healthy uptrend, price often pulls back to the 20 or 50 EMA and bounces. In a downtrend, rallies tend to stall at the same lines.
Part of the reason this works is that so many traders watch the same averages, especially the 50 and 200. Treat the line as a zone rather than an exact price, and wait for a rejection candle before acting on it.
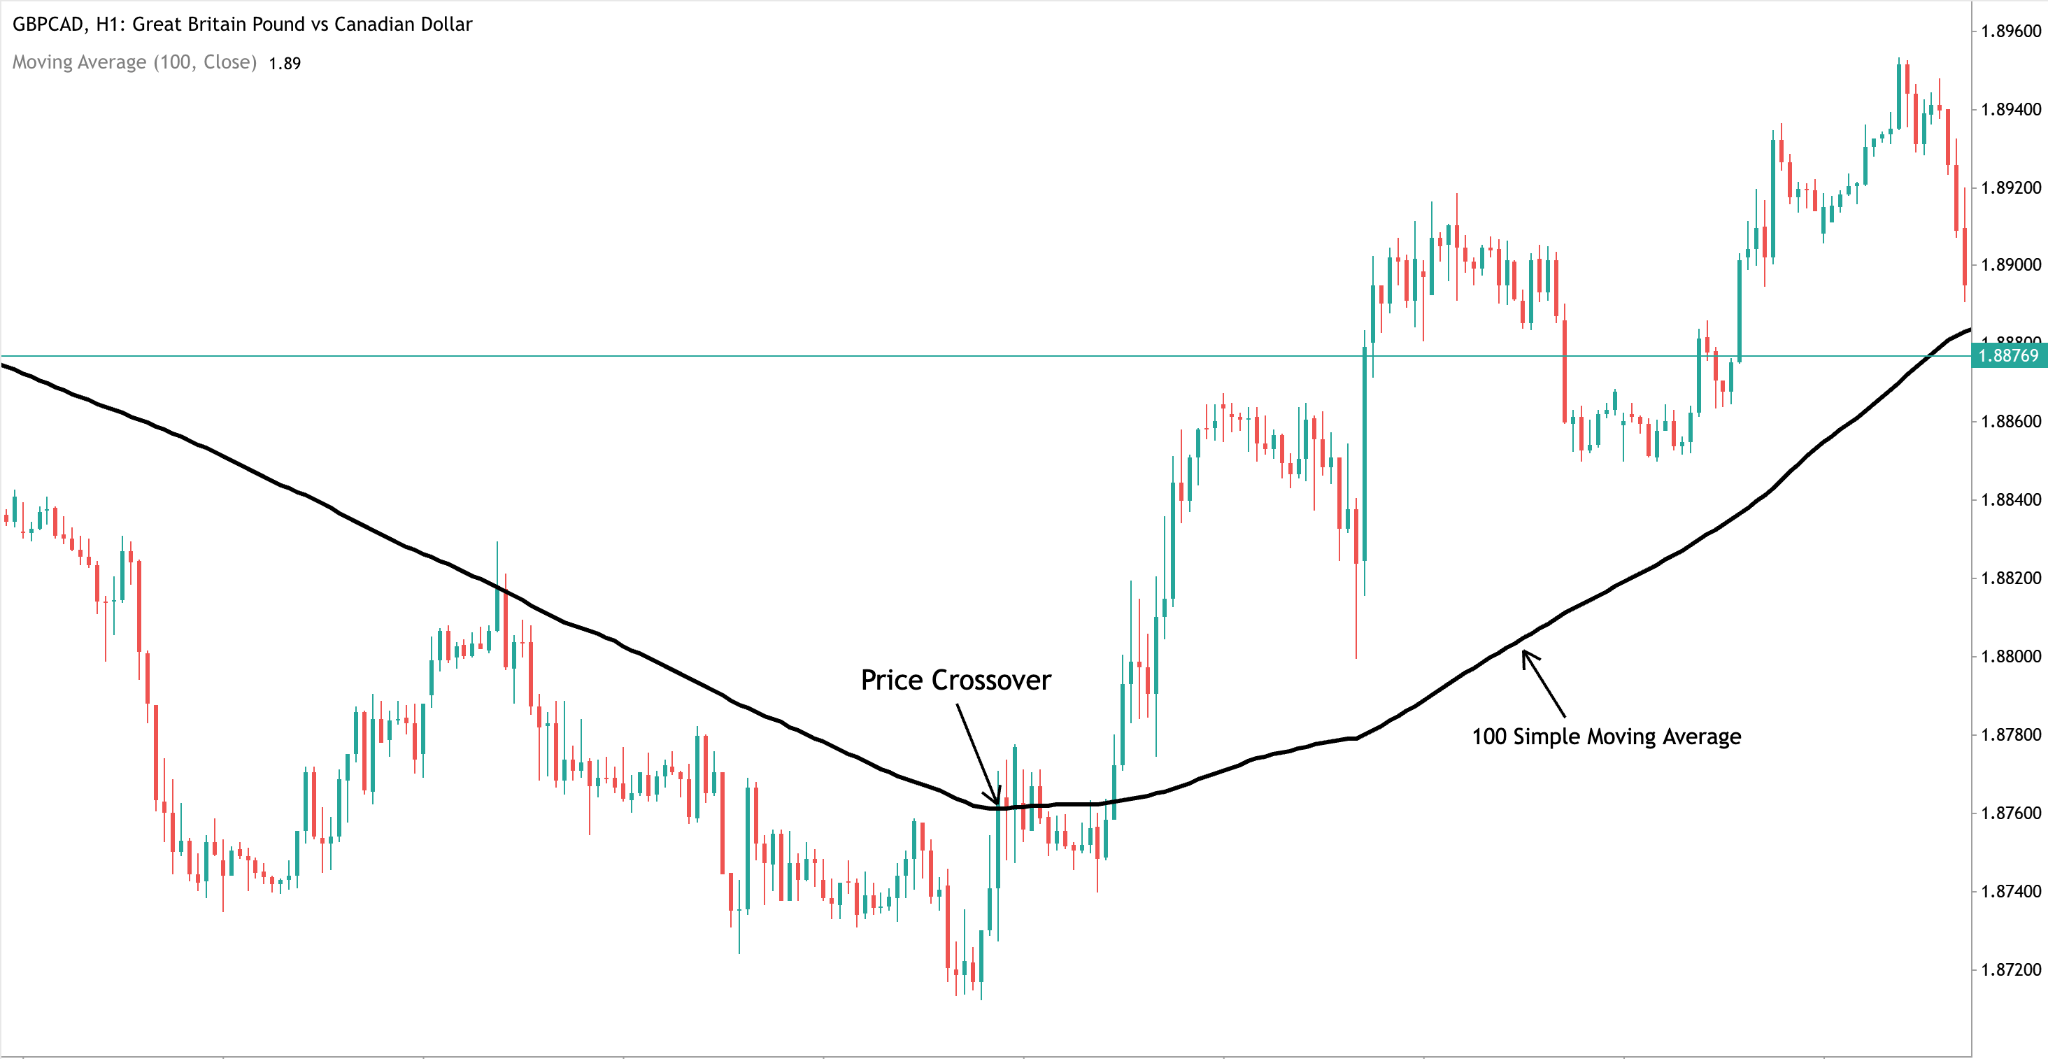
Trade Price Crossovers
A price crossover happens when the price closes on the other side of a moving average. A close above the average is a potential bullish shift; a close below is a potential bearish one. It's the most basic signal a moving average can give, and it's fast. The problem is that in a choppy market, price can cross the same line five times in a day or a week. A longer average, or a rule that requires two consecutive closes, cuts down the noise.
Trade Moving Average Crossovers
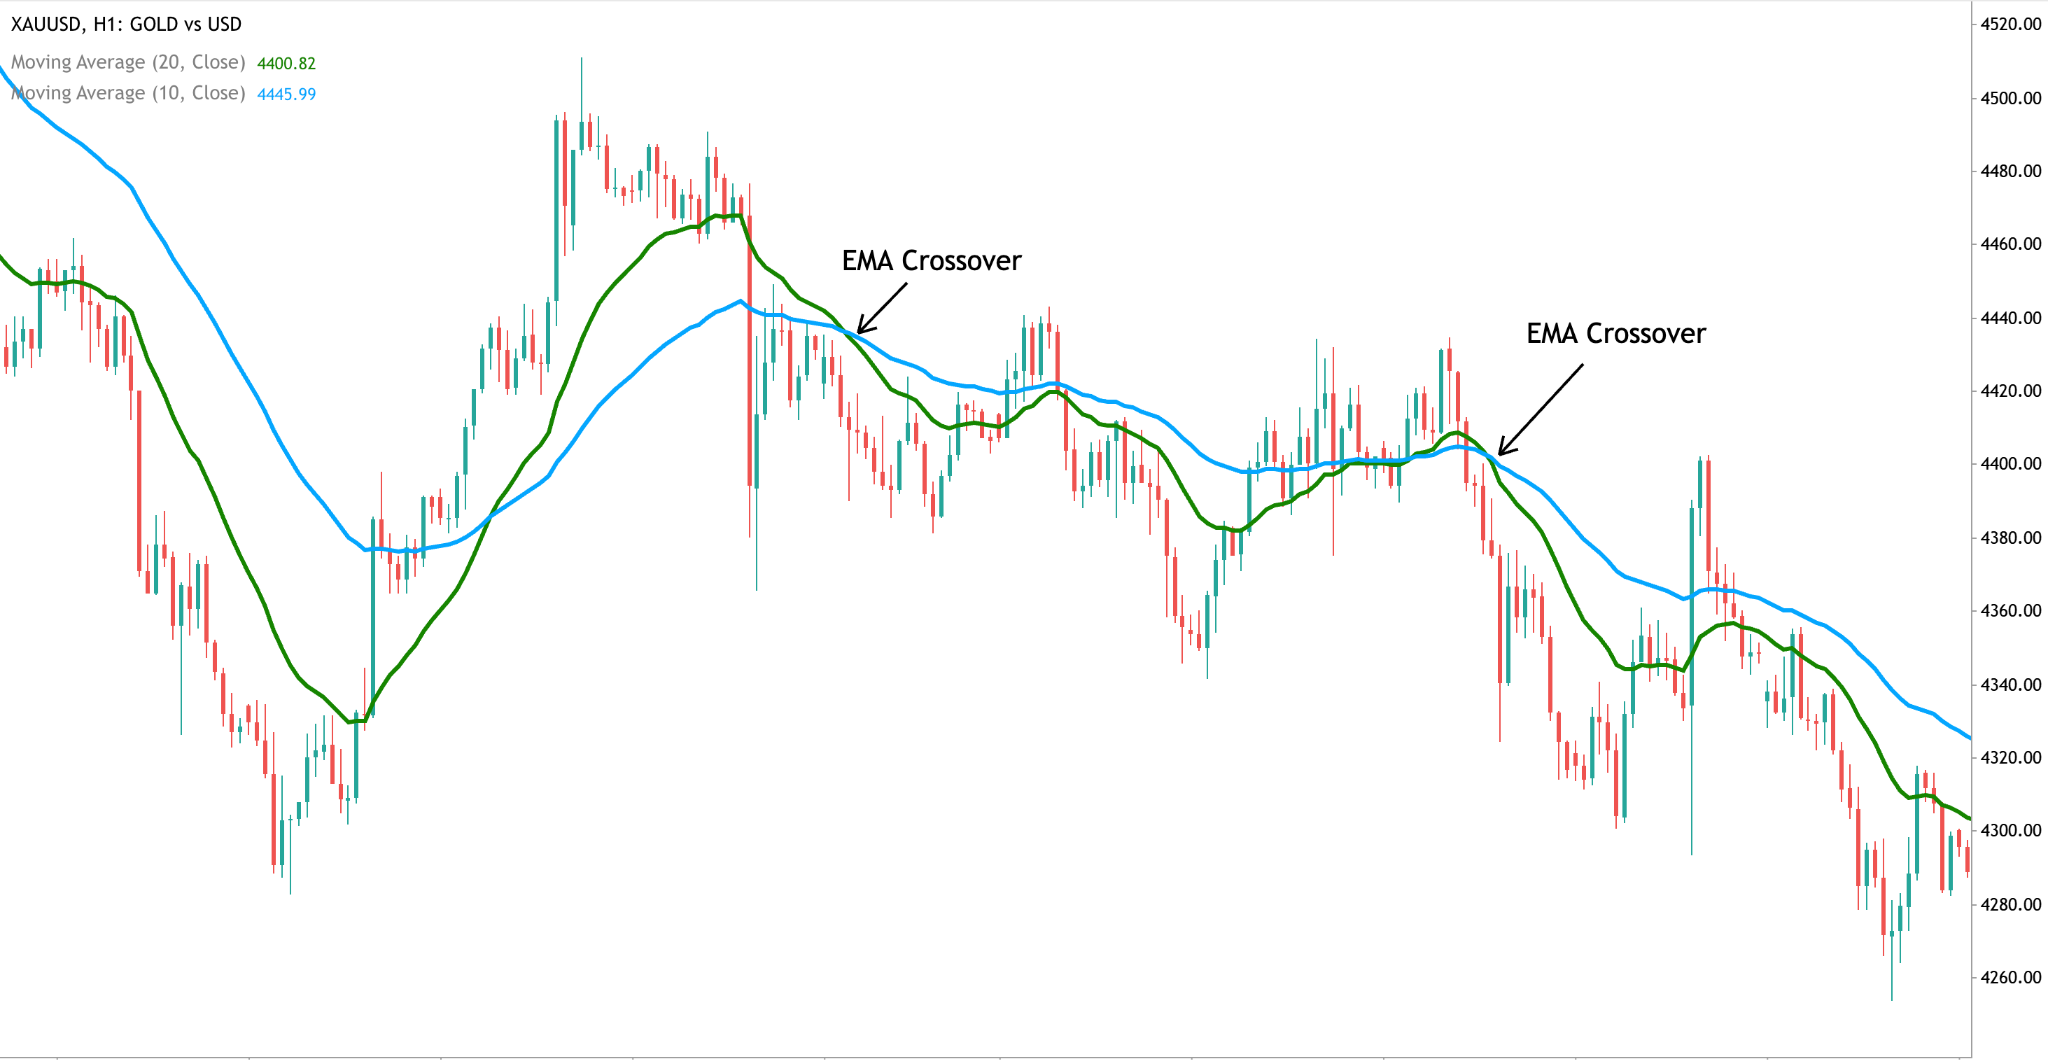
A moving average crossover uses two (and maybe even 3) lines: a fast one and a slow one. When the fast average crosses above the slow average, it's a bullish signal. When it crosses below, it's a bearish one. Traders often use the 10 and 30-day moving averages for crossovers. Other popular pairs include 9/21, 20/50, and 50/200.
Crossovers are smoother than price crossovers, but keep two things in mind. First, they lag: by the time the fast line crosses, part of the move has already happened. Second, in sideways markets, the two lines tangle together and cross repeatedly without any follow-through.
Watch for the Golden Cross and Death Cross
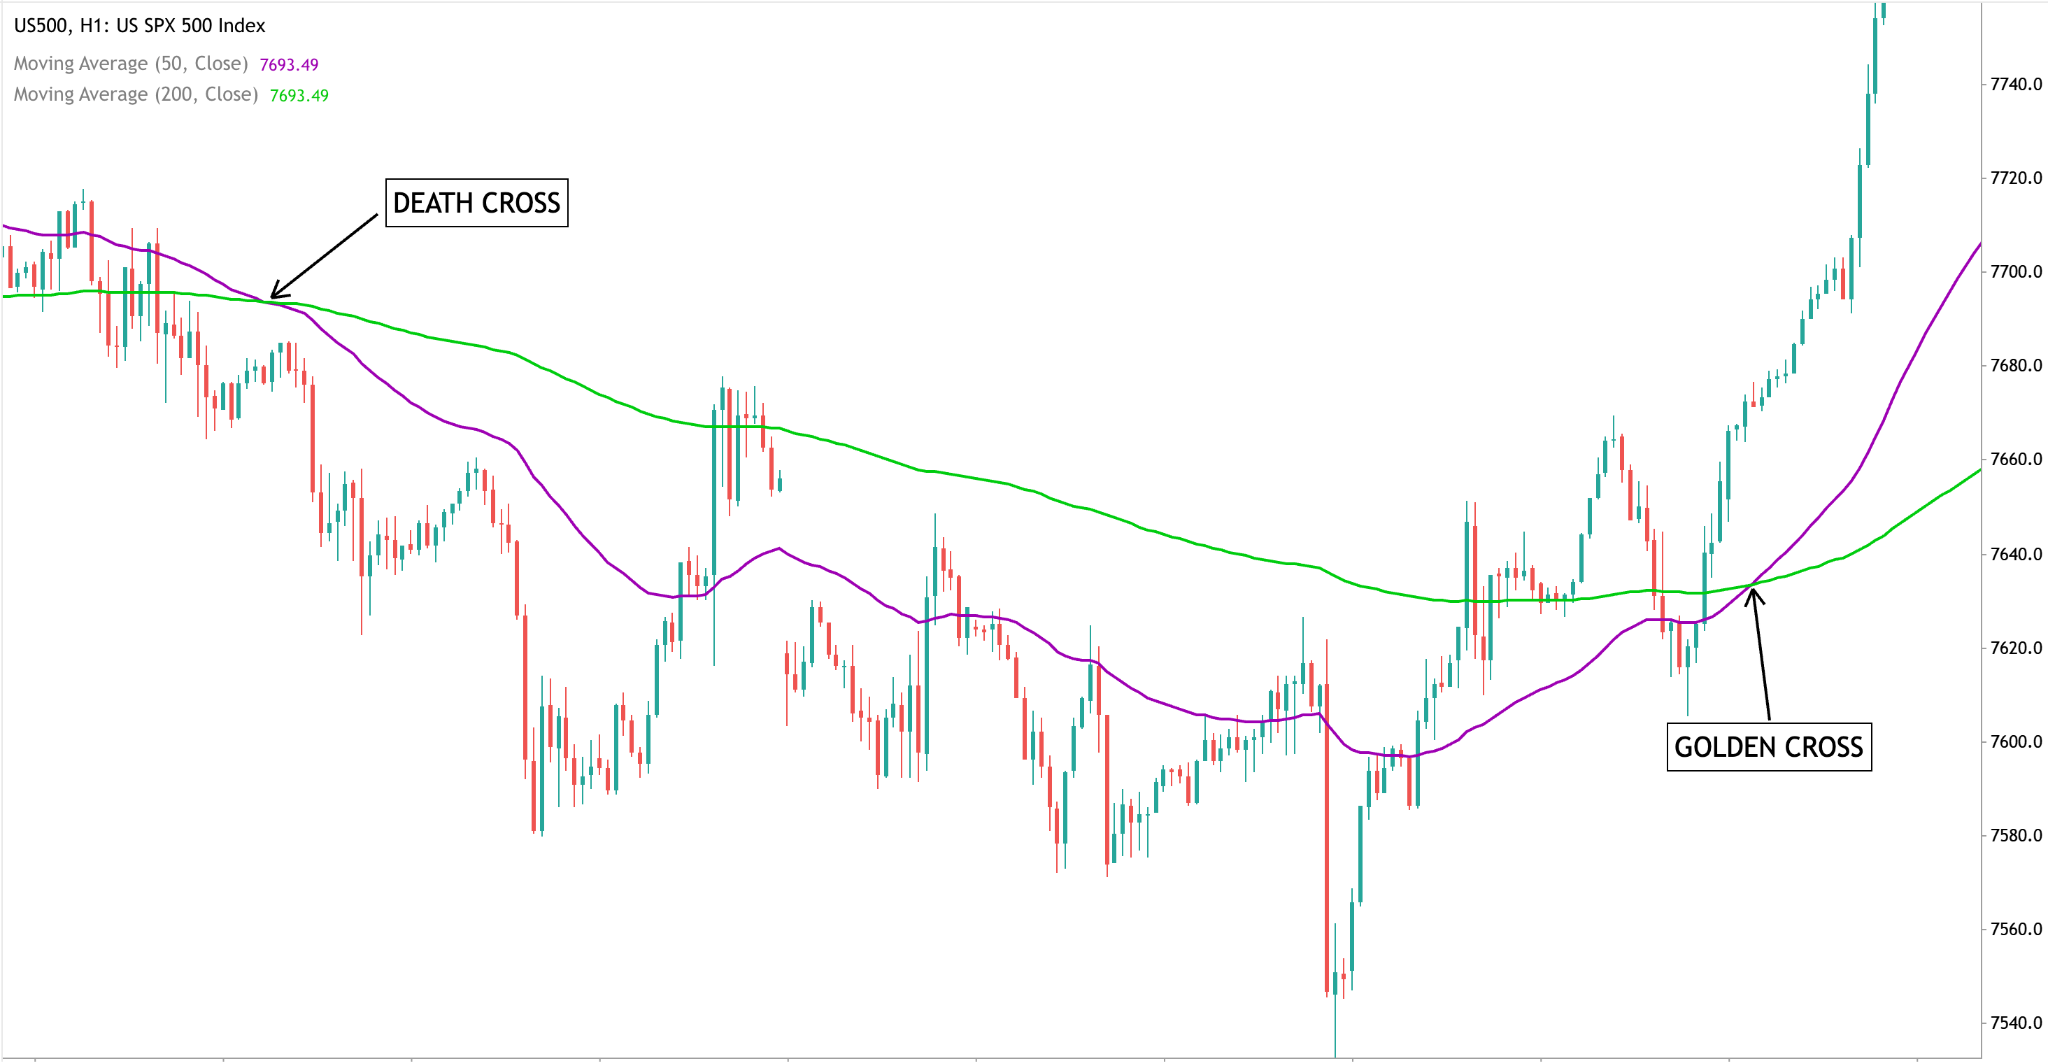
These are the most famous crossovers of all, and both use the 50-day and 200-day moving averages.
- Golden cross: The 50-day average crosses above the 200-day. This bullish signal suggests the long-term trend is turning up.
- Death cross: The 50-day average crosses below the 200-day. This bearish signal suggests the long-term trend is turning down.
These two moving average crosses are so important that even financial media report these signals on major indices. This is because they describe the long-term direction of the whole market. They're slow, though. A death cross can appear after much of a decline is already done, and a golden cross can come well into a recovery. You should treat them as confirmation of trend changes rather than early warnings.
Best Moving Averages by Timeframe and Trading Style
There's no single best moving average. This is subjective to the trader's strategy, preferred timeframe, and the right combinations that work well. Moreover, how long you plan to hold a trade and which chart you trade from determine the right setting. As a rough guide, 5–20 periods suit short-term moves, 50 periods suit medium-term trends, and 200 periods suit long-term trends.
Here's how that plays out by trading style:
One point that trips up many beginners: a moving average's period counts candles, not days. A 200-period average on a 5-minute chart covers about 16 hours of trading, not 200 days. Always match the setting to the timeframe you're trading.
With that in mind, here are some popular moving average combinations for each type of trading style:
Best Moving Averages for Scalping
Scalpers hold trades for seconds to minutes, so they need averages that react almost instantly to market movements. Short EMAs such as the 5, 8, 13 and 21 are the usual choice. Stacking the 8, 13 and 21 EMAs is a popular way to read momentum at a glance: when they're fanned out in order, the move has energy; when they twist together, it's time to step aside. Many scalpers also keep a 50 EMA on the 15-minute chart as a directional filter. Expect more false signals at this speed, and remember that spreads and commissions take a bigger share of each small profit.
Best Moving Averages for Day Trading
Day traders open and close positions within the same session, so they need moving averages that respond quickly to price changes. The 9 and 21 EMA crossover is a popular choice for spotting potential momentum shifts, while pullbacks to the 20 EMA on the 5- or 15-minute chart can help identify potential entry points in trending markets.
A 50 EMA on the hourly chart can help determine the broader session bias, allowing traders to align shorter-term setups with the overall trend. However, moving averages are lagging indicators and can generate false signals in choppy markets, so it's important to confirm them with price action and use proper risk management.
Best Moving Averages for Swing Trading
Swing traders hold positions for several days to weeks, making the 4-hour and daily charts useful for identifying trends and potential entry points. The 20 and 50 EMAs are popular choices for swing trading, with the 50-period moving average often used to assess the intermediate trend. When the price stays above a rising 50 EMA, it can indicate bullish momentum, while trading below a falling average may suggest a bearish trend.
Pullbacks to the 20 EMA can offer potential entry opportunities in strong trends, while the 50 EMA may act as a support or resistance area during deeper retracements. Traders can also use crossovers between the two averages to identify possible changes in momentum. However, these signals are not guarantees, so it's important to confirm them with price action and technical indicators.
Best Moving Averages for Long-Term Investing
Long-term investors focus on the primary market trend rather than daily price fluctuations, making the 50-day and 200-day Simple Moving Averages (SMAs) popular tools. The 50-day SMA helps track the intermediate trend, while the 200-day SMA is widely used to assess the longer-term direction of stock indices, individual shares, and commodities. On a weekly chart, the 40-week SMA provides a similar long-term perspective to the 200-day average.
Investors often watch how prices behave around these averages to assess market strength and potential trend changes. For example, a price holding above a rising 200-day SMA may indicate a sustained uptrend, while a break below a falling average could signal weakening momentum.
Top Moving Average Strategies
Below are three of the most popular moving average strategies. Each one includes the setup, entry, stop, exit and the market conditions it suits. Test any of them on a demo account before you trade real money.
1. The 8/13/21 EMA Strategy
The 8, 13 and 21 are Fibonacci numbers, and together they form a fast EMA ribbon that suits scalping and day trading.
- Setup: For a buy, the 8 EMA sits above the 13, the 13 above the 21, and all three slope upward with visible space between them. Reverse this for a sell.
- Entry: Wait for price to pull back into the zone between the 8 and 21 EMA, then enter when a candle closes back above the 8 EMA.
- Stop: Below the 21 EMA or the most recent swing low.
- Exit: When the 8 EMA crosses below the 13 EMA, or at a fixed reward-to-risk target such as 2:1.
- Best conditions: Clean trends on the 5-minute to 1-hour charts. Stay out when the three lines are flat and tangled.
2. The 9/20 EMA Crossover
The 9 and 20 EMAs pair a reactive momentum trigger with a short-term trend baseline, creating a straightforward crossover framework for intraday and swing setups.
- Setup: For a buy, the 9 EMA crosses above the 20 EMA with an upward slope. For a sell, the 9 EMA crosses below the 20 EMA with a downward slope.
- Entry: Enter at market on the crossover candle close, or wait for a pullback into the dynamic zone between the 9 and 20 EMAs before entering.
- Stop: Below the previous swing low for a buy, or above the previous swing high for a sell.
- Exit: When the 9 EMA crosses back over the 20 EMA in the opposite direction, or at a fixed reward-to-risk target of at least 1:2.
- Best conditions: High-liquidity windows such as the London/New York session overlap on major forex pairs, running on 5-minute to 4-hour charts. Avoid flat, consolidating ranges where moving averages compress and chop.
3. The Moving Average Bounce (Pullback) Strategy
This strategy uses moving averages as dynamic support and resistance.
- Setup: Confirm a trend with a rising 50 EMA and price trading above it.
- Entry: Wait for price to pull back to the 20 or 50 EMA, then buy on a bullish rejection candle such as a pin bar or bullish engulfing pattern.
- Stop: A few pips below the moving average and the swing low.
- Exit: At the previous swing high, or at a 2:1 reward-to-risk target.
- Best conditions: Established trends with orderly pullbacks. In a downtrend, flip the logic and sell rallies into a falling average.
Combining Moving Averages With Other Technical Indicators
If you've tried trading with moving averages without success in the past, what you might be missing is simply combining them with other technical indicators. Let's show you a few you could try out.
1. Relative Strength Index (RSI) and Moving Averages
While moving averages are great at telling us the overall direction of the market, they sometimes don't give us the clearest indication of when it's best to capitalize on the move. This is where the RSI comes in.
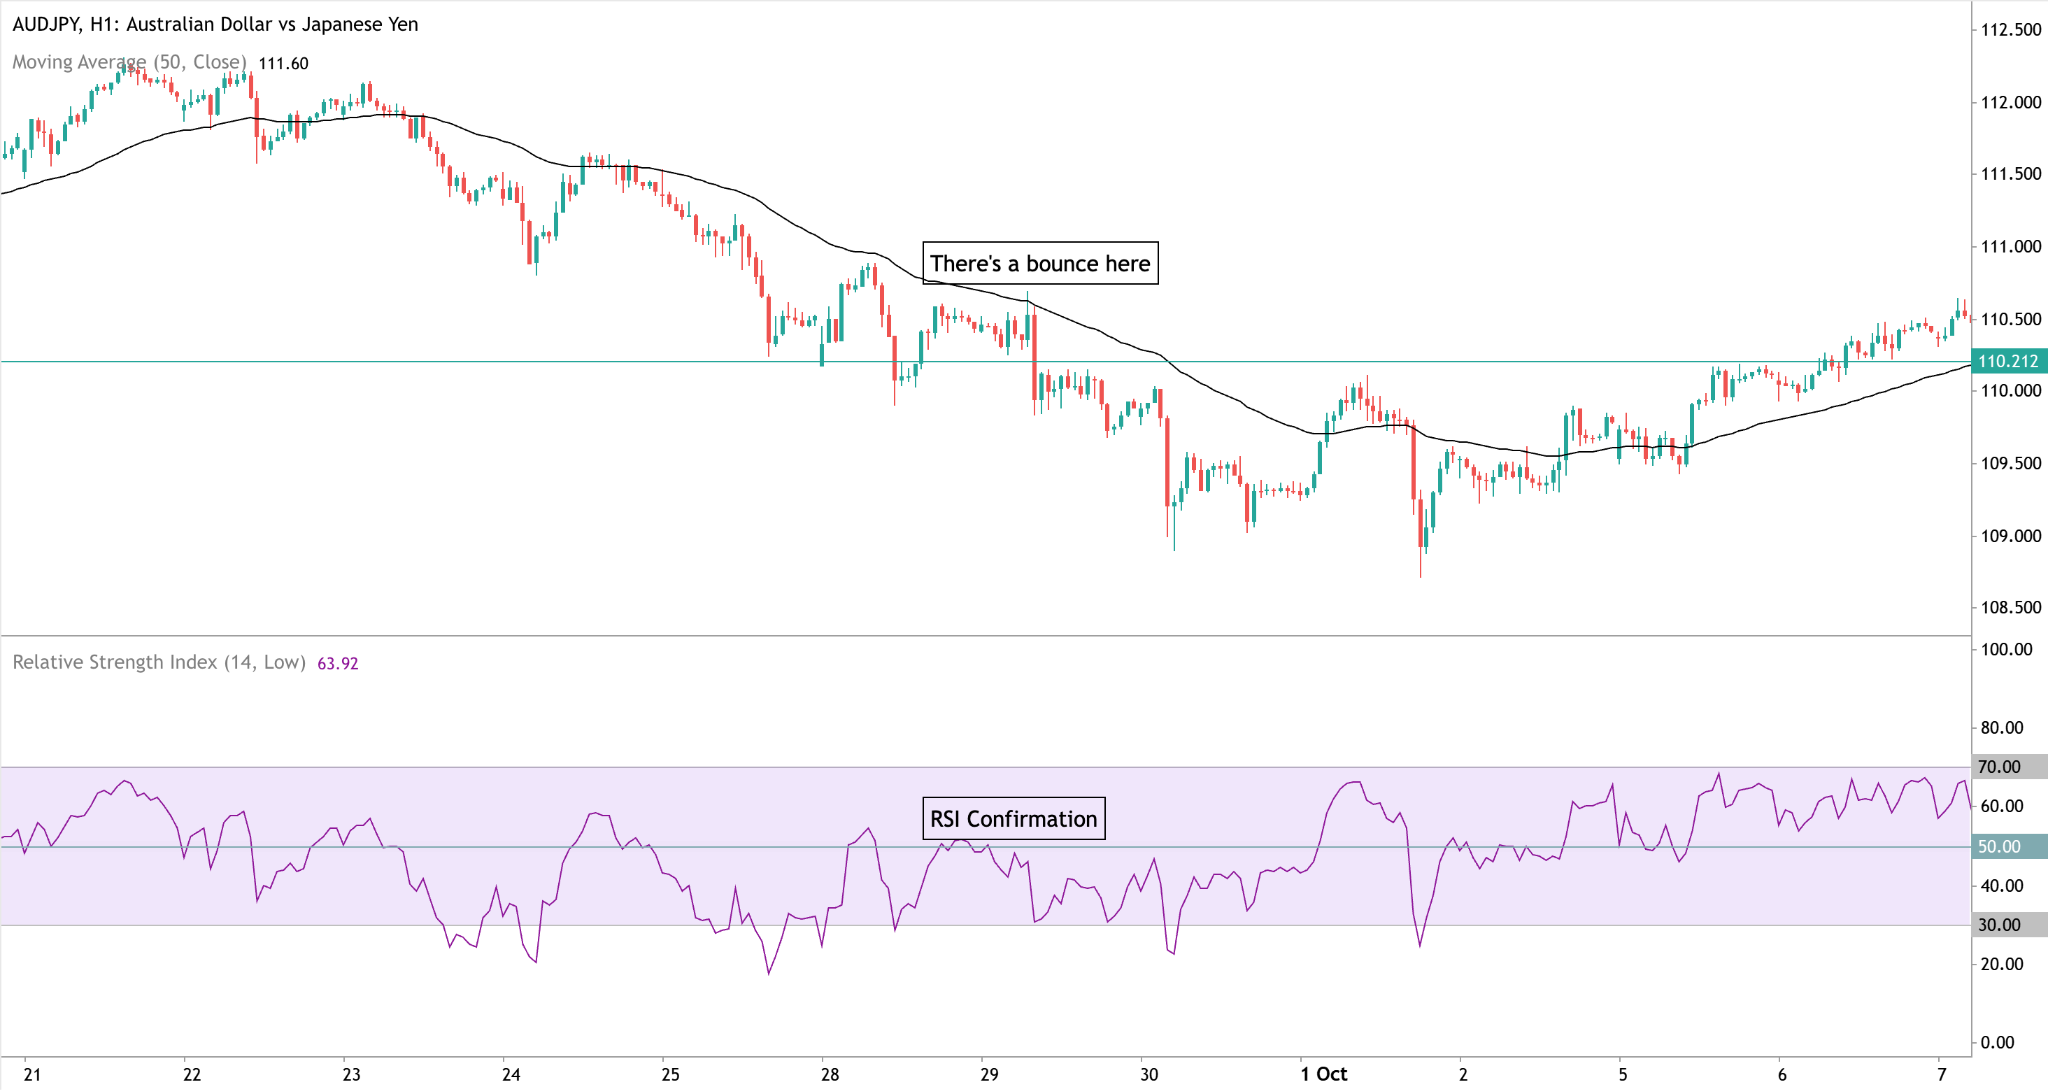
There are a lot of ways to combine these beautifully, but one of our favorites is using the two indicators to catch a trend continuation. Here's how to go about it:
Let's say the market is currently in an uptrend. What you want to do is wait for the market to pull back to the moving average of your choice, in this case the 13 EMA, while the RSI is also bouncing off the neutral 50 level.
Once you see these happening, what you should be doing is getting ready to buy immediately after a bullish candlestick pattern forms. That's it.
In a downtrend, just flip it. Wait for a rally into the 13 EMA with the RSI getting rejected at 50, then look to sell after a bearish candle forms.
Here's an example of this combination on a price chart:
2. Bollinger Bands and Moving Averages
Here's something a lot of traders don't realise: if you've ever used Bollinger Bands, you've already been trading with a moving average. The middle band is simply a 20-period SMA, and the outer bands sit two standard deviations above and below it.
So what does adding another moving average do for you? It gives the bands a direction. On their own, Bollinger Bands tell you when price is stretched, but they don't tell you which side you should be trading from. Add a 50 EMA and that problem goes away.
Here's how we like to use them together. If price is above a rising 50 EMA, you only care about the lower half of the bands. Wait for the market to dip into the lower band (or the middle band if the trend is strong), and get ready to buy once a candle closes back inside with some strength. In a downtrend, do the opposite and look for rallies into the upper band.
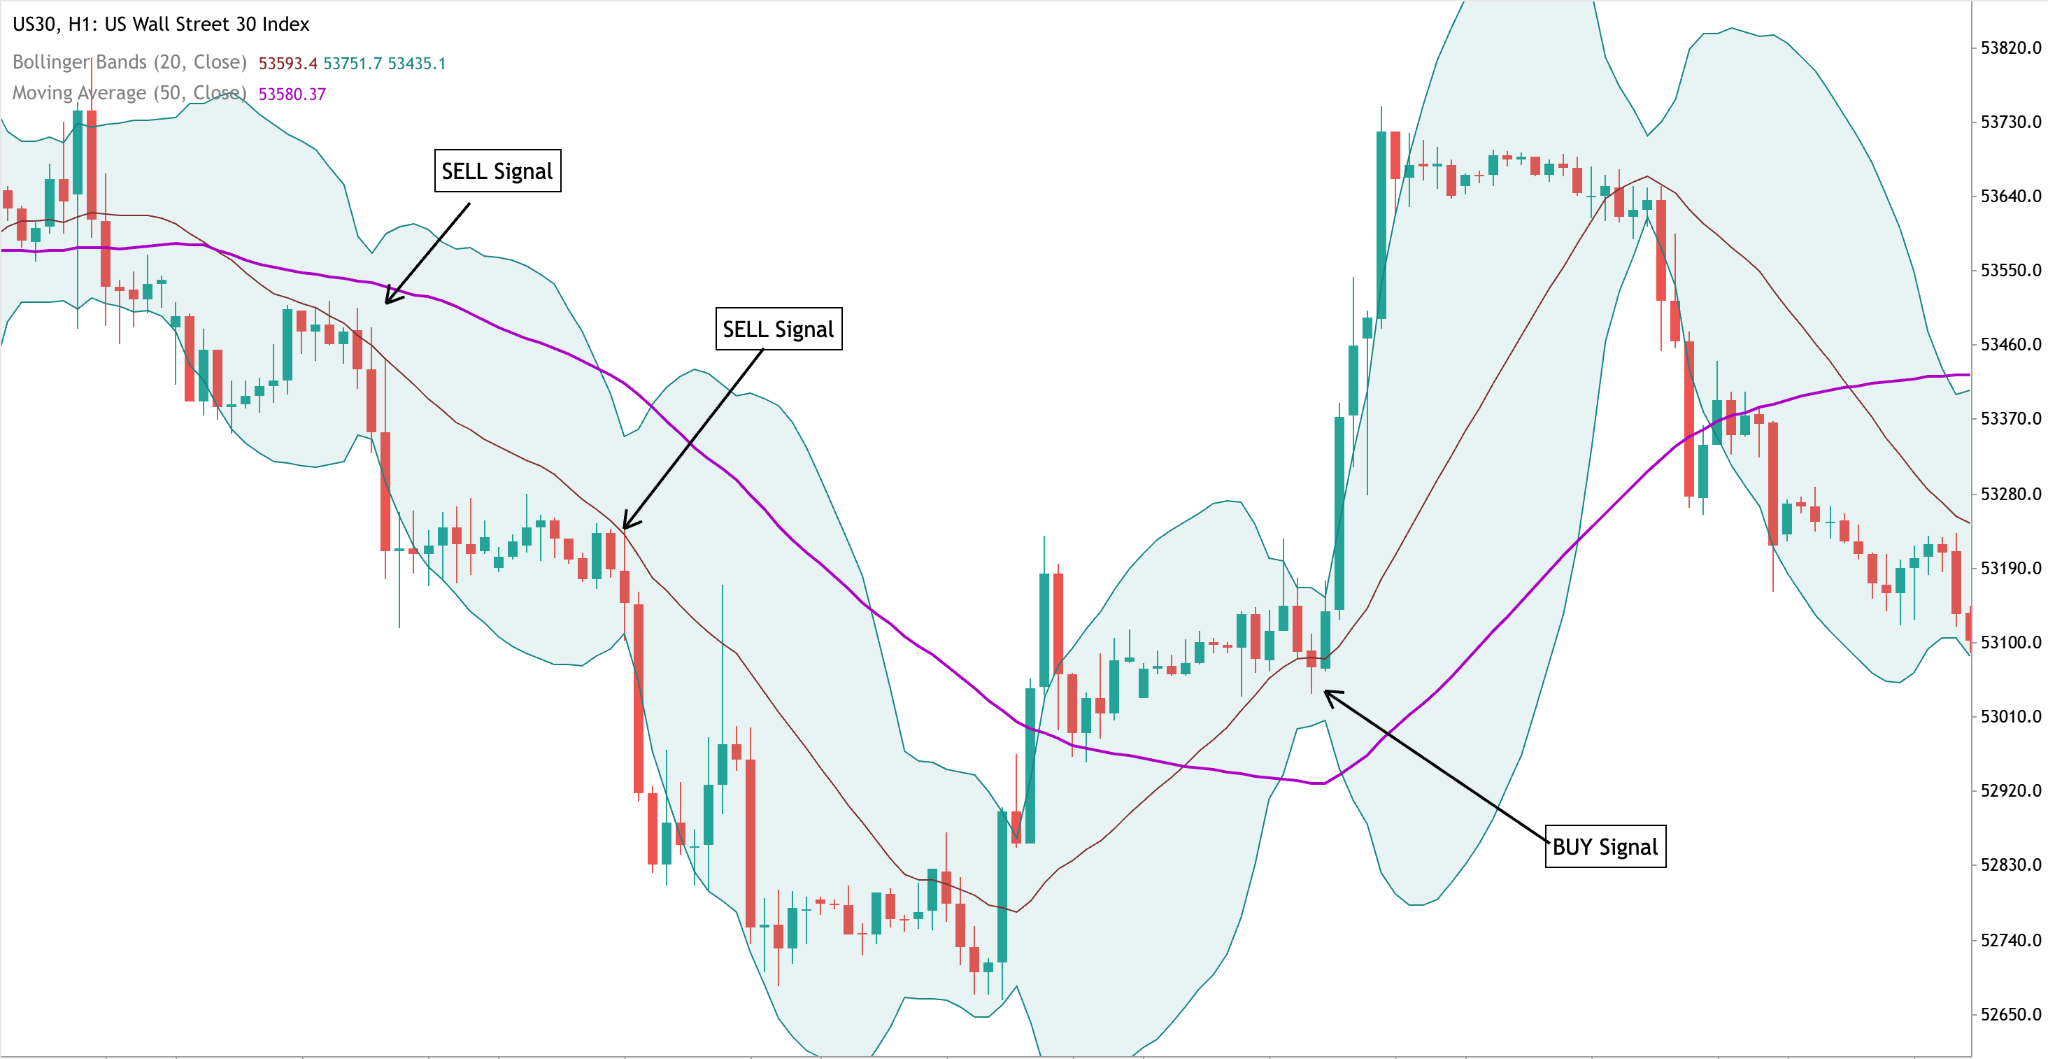
One more thing to watch for is the squeeze. When the bands pinch tight together and the 50 EMA goes flat, the market is resting. Don't force pullback trades here. Wait for price to break out of the squeeze and for the moving average to start sloping in that direction, then go back to buying dips or selling rallies.
3. MACD and Moving Averages
The MACD is built from moving averages too (the 12 and 26 EMA), so it pairs naturally with them. Where it really shines is timing your entries inside a trend that your moving average has already spotted.
Here's a simple way to put them together. Add a 200 EMA to your chart and only trade in its direction, so if price is above it, you're only looking for buys. Now wait for the MACD line to dip below its signal line during a pullback, and buy when it crosses back above. If that cross happens below the zero line, even better, because it tells you the pullback was a proper one and not just a pause.
In a downtrend, with price below the 200 EMA, you're waiting for the MACD line to cross back below the signal line after a rally.

How to Add Moving Averages on MT4 and MT5
If you've never added an indicator in MetaTrader before, don't worry. It sounds technical, but once you've done it once, it takes less than a minute. Let's walk you through it on MT4, MT5 and the mobile app.
How to Add a Moving Average on MT5
1. Open MT5 and log in to your account. A demo account works fine if you just want to practice.
2. Open the chart you want to trade. The quickest way is to find the pair in the Market Watch window (press Ctrl+M if you can't see it), right-click it and select Chart Window.
3. Go to Insert > Indicators > Trend > Moving Average. You can also open the Navigator window (Ctrl+N), expand Indicators > Trend and drag Moving Average straight onto the chart.
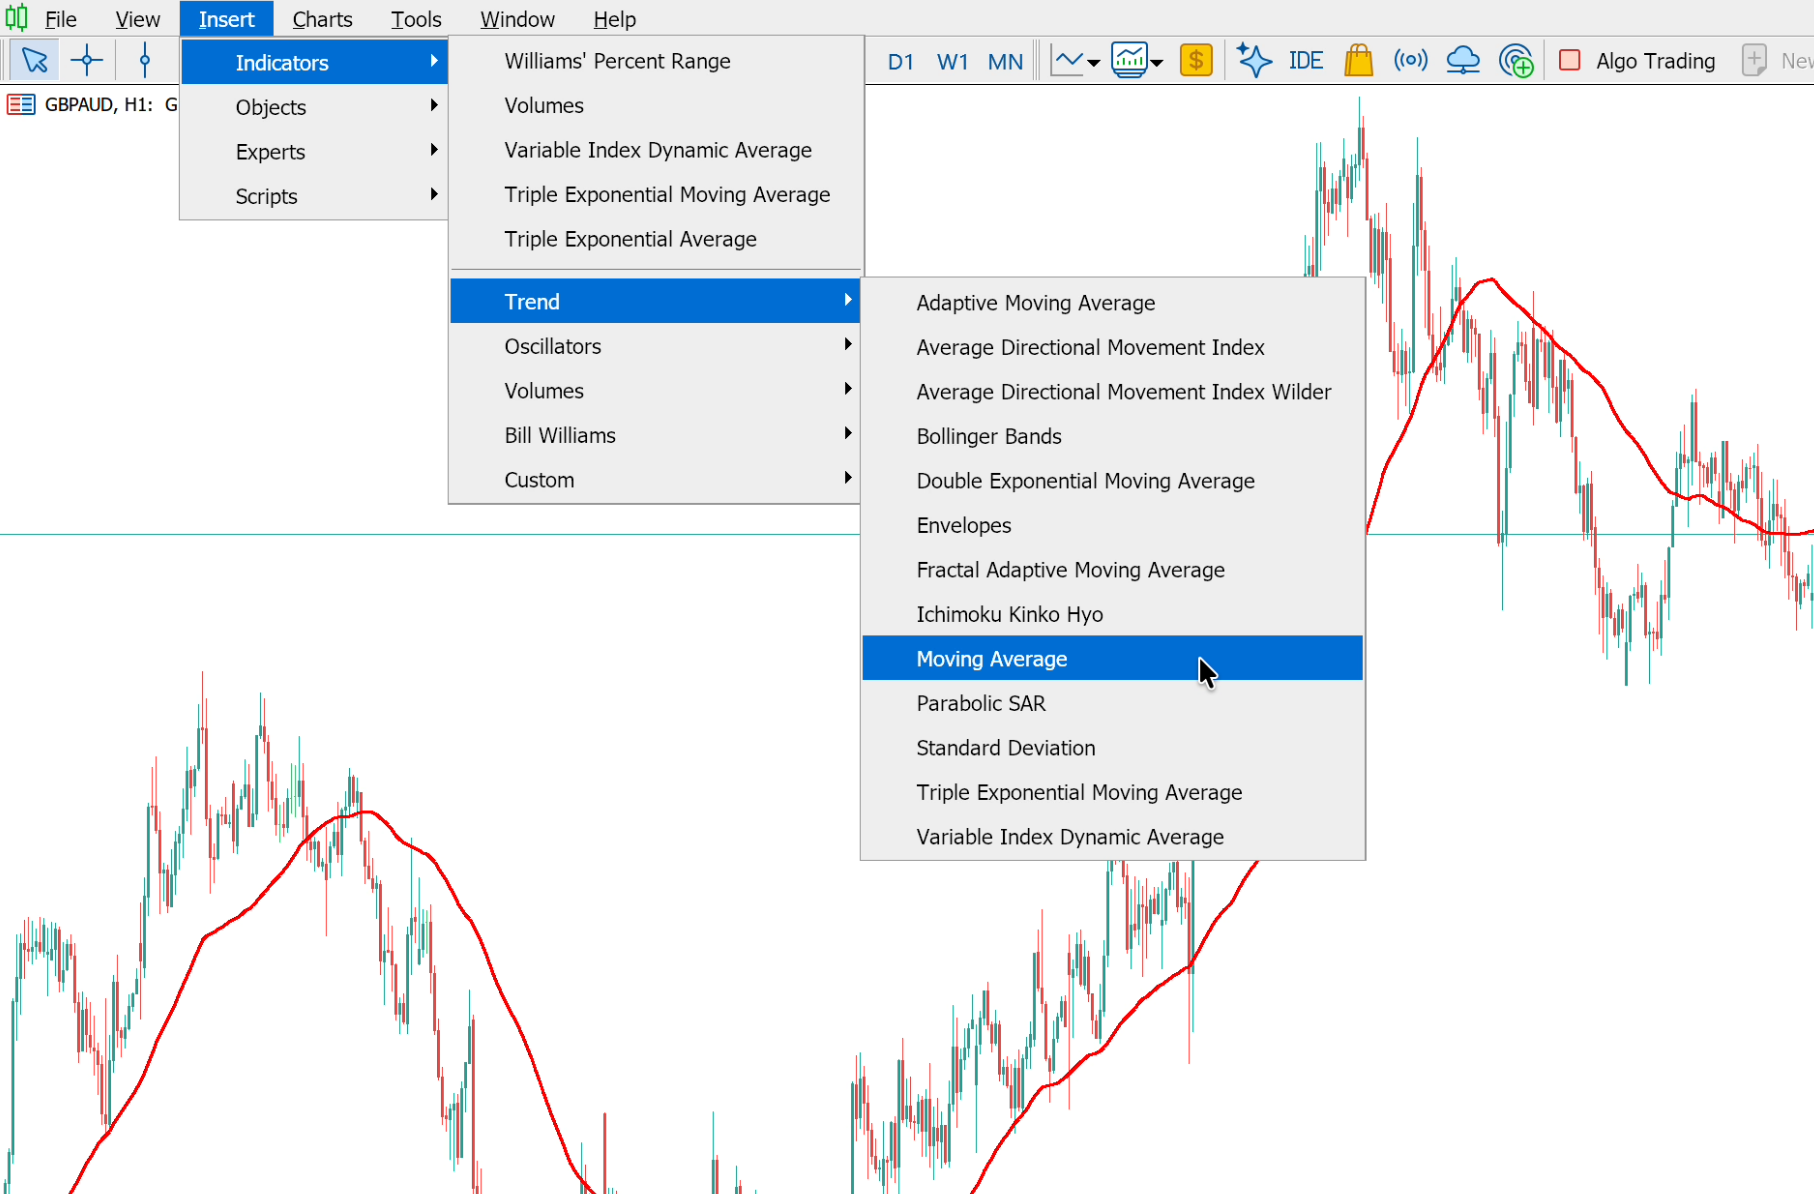
4. A settings window pops up. On the Parameters tab, fill in the following:
- Period: the number of candles to average, for example 50.
- Shift: leave this at 0.
- MA method: choose Simple for an SMA or Exponential for an EMA. Smoothed and Linear Weighted are there too.
- Apply to: Close, which is the standard choice.
- Style: pick a colour and line width you can see clearly against your candles.
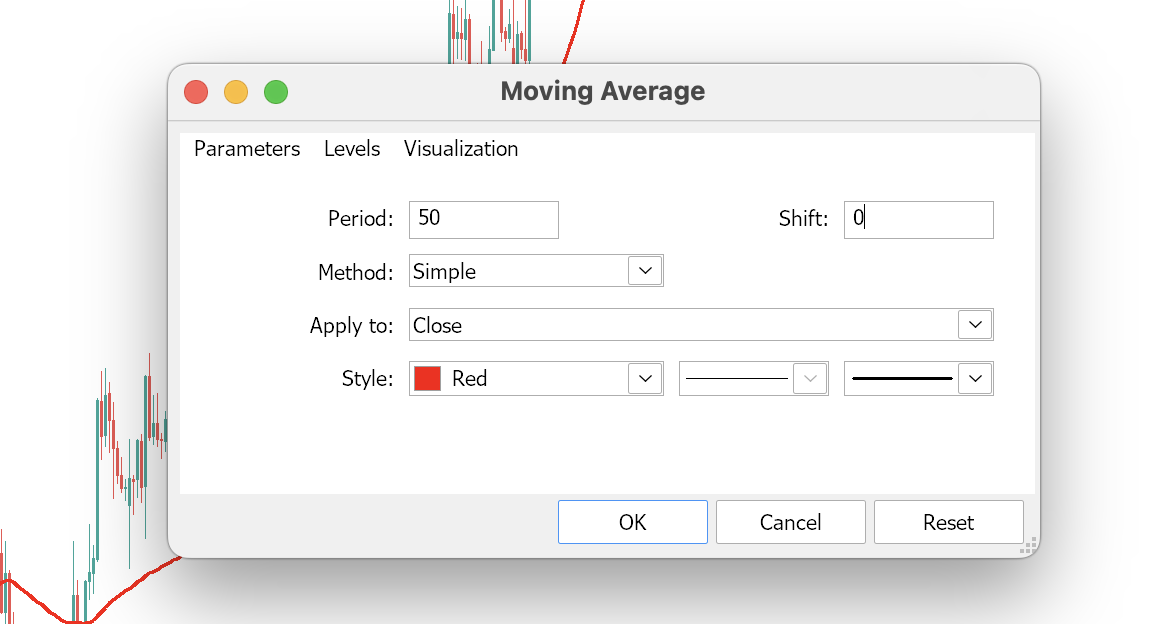
5. Click OK, and your moving average appears on the chart.
How to Add a Moving Average on MT4
MT4 works almost exactly the same way:
- Open MT4, log in, and open the chart you want from Market Watch (right-click the symbol and select Chart Window).
- Go to Insert > Indicators > Trend > Moving Average, or drag it onto the chart from Navigator > Indicators > Trend.
- On the Parameters tab, set the Period, Shift, Method (Simple, Exponential, Smoothed or Linear Weighted) and Apply to (Close), then choose your colour and line width.
- Click OK.
How to Edit, Remove or Save Your Moving Averages
To change a setting later, right-click the moving average line on the chart and open its properties. To remove it, right-click and choose Delete Indicator. If your chart is busy and the line is hard to click, press Ctrl+I to open the Indicators List, where you can edit or delete anything on the chart.
Once you've got a setup you like, save it as a template so you don't have to rebuild it every time. Right-click the chart, go to Template > Save Template and give it a name. Next time, right-click any chart, go to Template, and load it in one click. Here's a little trick: if you name the template "default", MetaTrader will apply it to every new chart you open.
One thing to note: the Hull Moving Average isn't built into MetaTrader, so you'd need to install it as a custom indicator first.
Switch Markets offers both MT4 and MT5, so you can build and practice these layouts on a free demo account before going live. And if you'd like to go a step further, Switch Markets' AlgoBuilder lets you turn a moving average crossover into an automated strategy and test it on historical data before trading it live.
Where Moving Averages Can Mislead You
We love moving averages, but we'd be lying if we told you they're perfect. Here are the mistakes we see traders make the most, and what to do instead.
1. Expecting Them to Catch the Top or Bottom
Every moving average is built from prices that have already happened, so it will always be late. Go back to the GBP/USD chart earlier in this guide. The 20 SMA didn't turn down until about nine candles after the 20 EMA did, and by then a good part of the move was already gone.
That isn't something you can fix with a better setting. It's just how the tool works. Use the moving average to confirm the direction, and use price action, like a break of structure or a rejection candle, to time your entry.
2. Trading Every Crossover in a Ranging Market
This is the one that hurts the most. When the market goes sideways, price cuts through the moving average over and over, and every cross looks like a signal. Take them all and you'll get chopped up by small losses.
A quick check we use before trusting any signal is to look at the slope. If the line is flat and price has crossed it several times in the last 20 or so candles, there's no trend to trade. Step aside and wait for the line to start pointing somewhere.
3. Treating the Line as an Exact Price
Price rarely touches the 50 EMA to the exact pip and bounces. Sometimes it stops just short, and sometimes it pokes through by a few pips before turning. Treat the moving average as a zone, not a line, and wait for a candle to close before you act.
The same goes for your stop loss. If you place it right on the moving average, you're putting it exactly where everyone else has theirs. Give it some room below the swing low instead.
4. Turning Your Chart into Spaghetti
If you can barely see the candles because of all the lines on your chart, that's a problem. Six or seven moving averages will give you six or seven different opinions, and you'll always find one that agrees with the trade you already wanted to take. Two or three is plenty: one for the trend and one or two for timing.
Above all, remember that a moving average is one tool, not a complete trading plan. Pair it with market structure, a second indicator if you like, and sound risk management.
Final Thoughts
Moving averages have lasted for decades because they do one job very well: they turn messy price action into readable market trends. The simple moving average gives you a steady, big-picture view. The exponential moving average gives you speed. Between them, and with the right period for your timeframe, you can define the trend, find dynamic support and resistance, and build entries around crossovers and pullbacks.
Just remember what they can't do. They lag, they whipsaw in ranges, and they work best as part of a wider plan. Start with one or two averages, test your chosen method on a demo account, and add other indicators for confirmation once the basics feel natural.
FAQs
Below are quick answers to the moving average questions traders ask most often, from choosing your first setting to using these lines on forex pairs.
What is the best moving average for beginners?
The 50 and 200-period simple moving averages are a good place to start. They're easy to read, widely watched, and they give a clear picture of the medium and long-term trend without too much noise. Once you're comfortable, add a faster EMA, such as the 20, for timing entries.
Is the EMA better than the SMA?
Neither is better in every situation. The EMA reacts faster because it gives more weight to recent prices, which suits short-term trading. The SMA is smoother and produces fewer false signals, which suits longer-term trend analysis. Many traders use both.
What does the 200-day moving average tell you?
The 200-day moving average is a common long-term trend reference. When price trades above a rising 200-day average, the long-term trend is generally considered up. When it trades below a falling one, the long-term trend is generally considered down.
Do moving averages work in forex?
Yes. Forex pairs often trend for long stretches, which makes moving averages a natural fit. They work less well when a pair is stuck in a tight range, so check the market conditions before relying on a signal.
What are the best moving average settings for day trading?
The 9 and 21 EMA crossover and the 20 EMA are among the most popular settings for day trading on the 5-minute to 1-hour charts. Many day traders also watch the 50 EMA on the hourly chart to gauge the session's overall direction.
Risk Disclosure: The information provided in this article is not intended to give financial advice, recommend investments, guarantee profits, or shield you from losses. Our content is only for informational purposes and to help you understand the risks and complexity of these markets by providing objective analysis. Before trading, carefully consider your experience, financial goals, and risk tolerance. Trading involves significant potential for financial loss and isn't suitable for everyone.